Rents are up 6.5% in San Francisco, and 4.5% in numerous other cities. Is this a leading indicator for a stronger inflation as measured by the CPI.
Please consider the Variant Perception article Higher Rents in the US are a Strong Support for CPI.
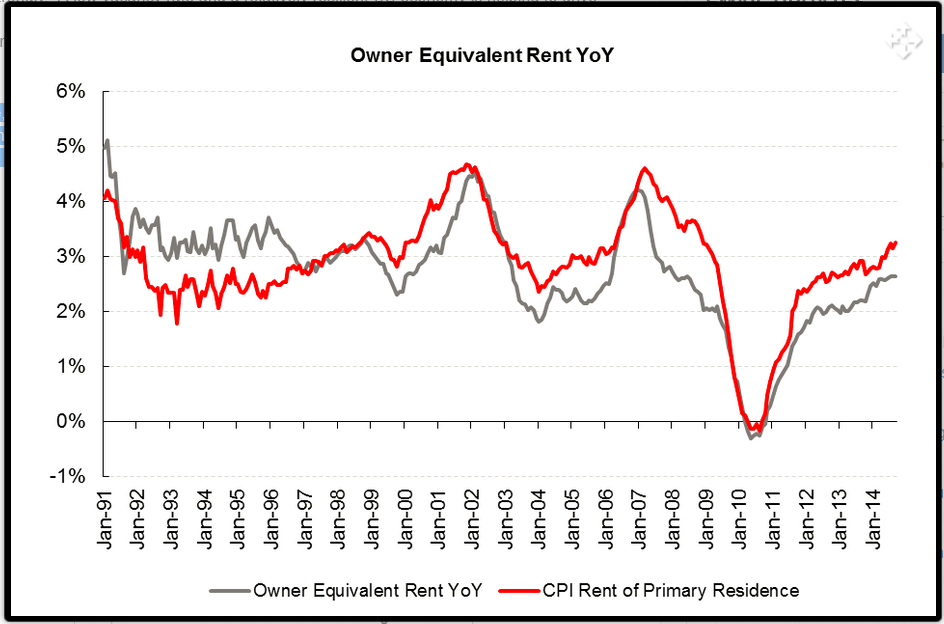
Despite the subdued nature of US CPI, some large components are turning up. Owners’ equivalent rent and rent of primary residence, which together account almost of a third of the CPI basket, are turning up strongly. A low vacancy rate and a relatively resilient US economy is helping to drive rents higher, with San Francisco seeing the greatest rent increases, at 6.4% over the last year, and with many other cities, such as Nashville, Seattle, Denver and Houston, all seeing increases of over 4.5%
Furthermore, our leading indicator for US Shelter CPI, which includes apartment vacancy rates and the growth in the working-age population among its inputs, shows that the trend should continue. Higher rents are a strong support for headline CPI in the US.
Owners Equivalent Rent
Owners Equivalent Rent vs. CPI Shifted 18 Months

The above chart shows strong correlation between OER and the CPI going forward. Does that make OER a leading indicator for the CPI?
Not so fast. I took the above chart, clipped out the red CPI line, made a layer out of it in Photoshop, and then shifted the line back 18 months with reduced opacity so you can see both lines. Here is my result.
Owners Equivalent Rent vs. CPI Shifted 18 Months and Not Shifted

Does VP’s shifted CPI show any better correlation than unshifted?
Straight up (no shift) caught most of the action correctly, except for years 2005-2006, right at the peak of the housing bubble. Also recall the energy spike in 2007.
OER appears to be coincident indicator. This makes sense given it’s the single largest component in the CPI.
CPI Housing Component
Let’s take a look at the Housing Component of the CPI straight from the October 2014 BLS CPI Report.

The last column above is the year-over-year increase in various housing components. Numbers are national. On average, if the largest cities are up 4.5% or so (excluding San Francisco), the national average of 2.7% for OER and 3.3% for rent seems reasonable enough.
CPI-U Consumer Price Index for All Urban Consumers is up 1.7% year-over-year even though housing is up 2.7%. So other things had to go down. Price for energy did just that.
Nonetheless, CPI will tend to move with OER simply because OER is the single largest component.
If rents continue to rise, CPI will likely go along for the ride, but I fail to see any leading direction in the OER itself unless one can accurately project “planned rent hikes”.
With that thought in mind, let’s return to the claim “Our leading indicator for US Shelter CPI, which includes apartment vacancy rates and the growth in the working-age population among its inputs, shows that the trend should continue.“
If vacancy rates are a leading indicator of planned rents hikes (a reasonable presumption), then the statement made by Variant Perception is likely an accurate one. Yet, the overall impact on the CPI will at best be subdued, especially if wages do not follow.
Mike “Mish” Shedlock
http://globaleconomicanalysis.blogspot.com