Even just a quick glance at the S&P 500 chart reveals a tug-of-war between bulls and bears, buyers and sellers. Although there’ve been many – at time violent – swings, there’s been no net progress.
What will we see first, new highs or new lows? Here’s a look at various pieces of market research:
Long-term:
Hypervolatility – April 11, 2018 Profit Radar Report:
“What a contrast: In 2017, the S&P 500 swung more than 1% on only 10 days. That’s measured from daily high to low, not open to close. In 2018, the S&P 500 had already 41 daily swings of more than 1%.
Below is a closer look at actual volatility, not the VIX. The first chart plots the S&P 500 against the daily percentage change measured from high to low (gray graph) along with a 20-day SMA of the daily percentage change (blue graph).
Barron’s rates iSPYETF as “trader with a good track record” and Investor’s Business Daily says: “When Simon says, the market listens.” Find out why Barron’s and IBD endorse Simon Maierhofer’s Profit Radar Report.

In February, the daily swing range was nearly as big as in September 2015 and January 2016, which is when stocks bottomed. Back then, volatility came and went quickly (like the shape of a ‘V’). This time around, volatility is lingering longer.
The second chart provides a long-term perspective, which includes the 1974, 1987, 2002, 2007, and 2011 market lows. Back then, daily swings (20-day SMA) peaked around 4%, twice the current average of around 2%.

Based on positive liquidity (NYC a/d line) and the parallels to 2011, it’s unlikely that the daily swing range will double from 2% to 4% as stocks melt lower.
The main takeaway is that volatility extremes are usually seen towards market lows.”
Elliott Wave Theory (EWT) – February 11, 2018 Profit Radar Report:
“For well over a year stocks have almost exclusively gone up, slow but steady. For the past two weeks, stocks have gone down quickly.
What’s next? The temptation (and trap) is to think two dimensional – up or down – since that’s most of what we’ve experienced lately. However, stocks could also go sideways for a period of time.
The weekly S&P 500 chart provides some long-term perspective. 1 – 2 – 3 is how we label the rally from the February 2016 low. Wave 3 (wave 5 of wave 3 to be exact) extended much higher than normal.

Based on EWT, wave 3 is followed by wave 4, which is where we are currently at. Waves 4 are generally choppy, range-bound, long-winded, unpredictable corrections that retrace ideally 38.2% of the preceding wave 3. The 38.2% Fibonacci retracement level is at 2,536 (reached on Friday).
In terms of price, wave 4 has already reached its down side target. In terms of time, wave 4 would be unusually short.”
Liquidity – April 18, 2018 Profit Radar Report:
On the bullish side of the ledger, we find that the NY Composite advance/decline line (and NYC OCO a/d line) made new all time highs. This follows the bullish divergence noted in the April 4 PRR.
Long-term summary:The weight of evidence suggests that this correction will be temporary and followed by new all-time highs. But how much longer will this correction last and how low can it go?
Short/Mid-term:
Breadth – May 2, 2018 Profit Radar Report:
“As early as February 11, the Profit Radar Report expected a frustrating, drawn out correction like in 2011. There are many parallels between the 2011 and 2018 correction, but here is one difference:
In 2011, there were multiple strong up days (where more than 80% or 90% of stocks advanced – green lines), and strong down days (where more than 90% of stocks declined – red lines).
The strong down days exhausted sellers, and the strong up days indicated internal strength not yet reflected in price.

The 2018 correction is much different. There’ve been only two days that come close to be considered a 90% down day, and only one 80% up day.

To end this sideways range, it appears that either more 90% down days or 80%-90% up days (like in October 2011, see green arrow) are needed. Ideally we’d like to see both, first a bout of strong down days followed by strong up days.”
Seasonality, cycles, pattern – May 6, 9, 2018 Profit Radar Report:
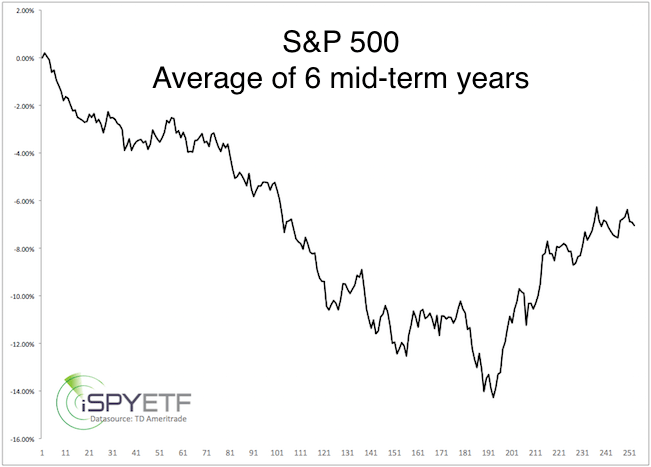
“Based on mid-term seasonality (blue graph, chart below), the S&P has a tendency to bottom between late June and late September. Cycles are fairly similar to seasonality at this time.

Year-to-date the S&P is down 0.38%. Since 1950, the S&P 500 showed at loss of 1% (but no more than 5% below 200-day SMA) after the first 4 months 17 other times.. 6 of those 17 instances occurred in mid-term election years (like 2018). The average full-year performance is shown below (average bottom: trading day #193).”
Summary:
The April 2 Profit Radar Report (when the S&P 500 closed at 2,582) stated that: “The S&P 500 has met the minimum criteria to consider this correction complete. There is, however, a difference between minimum and ideal.”
The S&P continues to be stuck in the ‘twilight zone between minimum and ideal.’

Short-term, the May 13 Profit Radar Report probably defined it best: “The S&P 500 broke above triangle resistance. Although we view this breakout with a fair amount of skepticism, we need to allow for higher prices while trade remains above 2,700. Due to the overbought condition, it is unlikely for the S&P to move above 2,750 early this week.”
Continued updates will be available via the Profit Radar Report.
Simon Maierhofer is the founder of iSPYETF and the publisher of the Profit Radar Report. Barron’s rated iSPYETF as a “trader with a good track record” (click here for Barron’s profile of the Profit Radar Report). The Profit Radar Report presents complex market analysis (S&P 500, Dow Jones, gold, silver, euro and bonds) in an easy format. Technical analysis, sentiment indicators, seasonal patterns and common sense are all wrapped up into two or more easy-to-read weekly updates. All Profit Radar Report recommendations resulted in a 59.51% net gain in 2013, 17.59% in 2014, and 24.52% in 2015.
Follow Simon on Twitter @ iSPYETF or sign up for the FREE iSPYETF Newsletter to get actionable ETF trade ideas delivered for free.
