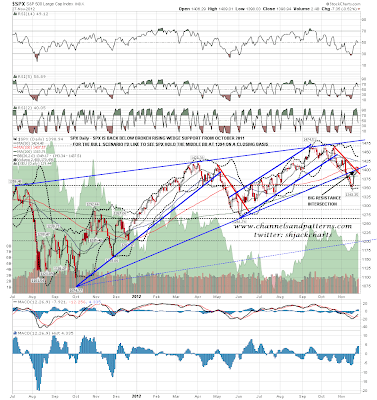
I was saying yesterday morning that the short term bear scenario seemed more likely to play out on balance, and it has been playing out since. I’m seeing some positive divergence on the ES 15min RSI and it’s possible that a low is being made in the pre-market, but on balance it seems likely that we’ll see lower today. On the daily chart I would ideally like to see SPX hold the middle bollinger band at 1394 on a closing basis for the bull case:
I’ve been considering the bull and bear cases here on the shorter timeframe SPX charts, and I’ll lead with the bull case on the SPX 15min chart. I’ve been considering whether there is a technically valid IHS on the 15min chart, and I think there is, though I’d have liked the right shoulder to go deeper and last longer. The neckline is in the 1388-90 area and that area is the neckline retest target. The stumpy right shoulder bottomed at 1377.04 and if we see SPX go any lower than that on this retracement I would disregard this pattern. The IHS target is in the 1434 area at a major resistance level there:
I’m leaning strongly towards the bull case here, but there is still merit in the bear case, and the odds of that playing out increase between 1388 and 1377.04 SPX. Below 1377.04 it will become my preferred scenario. On the bear scenario the recent highs were a retest of the H&S neckline, which would now reverse downwards again with a target in the 1325 area. What I would say here is that a neckline retest after an H&S has played out 75% of the way to target is rare, and I’d normally be looking for failure on this pattern at this stage:
On the ES 60min chart I showed two patterns yesterday morning, and they were a possible double-top and a 70% bullish ascending triangle that I thought was nonetheless more likely to break downwards. Both patterns have since broken down,and if I’m sounding doubtful this morning about strong resistance turned support in the 1386-8 ES area holding, that’s because the double-top target is 1383 and the triangle target is 1380.5 with a 68% chance of making target according to Bulkowski. That’s two pattern targets both pointing to a break below 1386 and that is well worth thinking about here. There is decent support in the 1380 ES area and I’d be looking for reversal there. The prospects for the bull case look increasingly grim on any conviction break below that:
I was looking at a possible double or M top on EURUSD yesterday and that also broke down. it hasn’t made the 1.288 target yet and there is strong support just below that in the 1.2875 area. If EURUSD breaks below that then we may well see a retest of broken broadening wedge resistance in the 1.288 area. Overall this is still very much a bullish pattern setup:
On CL there is still a strong bull scenario but short term the break of the rising support trendline is suggesting a test of strong support in the 85 area. I have found a possible declining channel on CL, so that 85 support area is very important. On a conviction break below 85 my channel support target would be in the 80 area:
As I said in the opening paragraph, there is some reason to think that ES might be making a premarket low, and when a double-top triggers and fails, that’s generally close to the pattern valley low, which is close above. On balance though I’m expecting more downside, with a likely target in the 1380-8 area. That will be a buy opportunity in my view unless we see ES lose 1380 and then SPX trade below 1377.04. I’ll be posting a gold chart on twitter after the open today as there is a rising wedge there from the last low, but I’m running low on time.


