The NAR reports: Existing-Home Sales Slip in December, Prices Continue to Rise; 2012 Totals Up
Total existing-home sales, which are completed transactions that include single-family homes, townhomes, condominiums and co-ops, declined 1.0 percent to a seasonally adjusted annual rate of 4.94 million in December from a downwardly revised 4.99 million in November, but are 12.8 percent above the 4.38 million-unit level in December 2011.
The preliminary annual total for existing-home sales in 2012 was 4.65 million, up 9.2 percent from 4.26 million in 2011. It was the highest volume since 2007 when it reached 5.03 million and the strongest increase since 2004.
…
Total housing inventory at the end of December fell 8.5 percent to 1.82 million existing homes available for sale, which represents a 4.4-month supply at the current sales pace, down from 4.8 months in November, and is the lowest housing supply since May of 2005 when it was 4.3 months, which was near the peak of the housing boom.Listed inventory is 21.6 percent below a year ago when there was a 6.4-month supply. Raw unsold inventory is at the lowest level since January 2001 when there were 1.78 million homes on the market.
 Click on graph for larger image.
This graph shows existing home sales, on a Seasonally Adjusted Annual Rate (SAAR) basis since 1993.
Sales in December 2012 (4.94 million SAAR) were 1.0% lower than last month, and were 12.8% above the December 2011 rate.
The second graph shows nationwide inventory for existing homes.
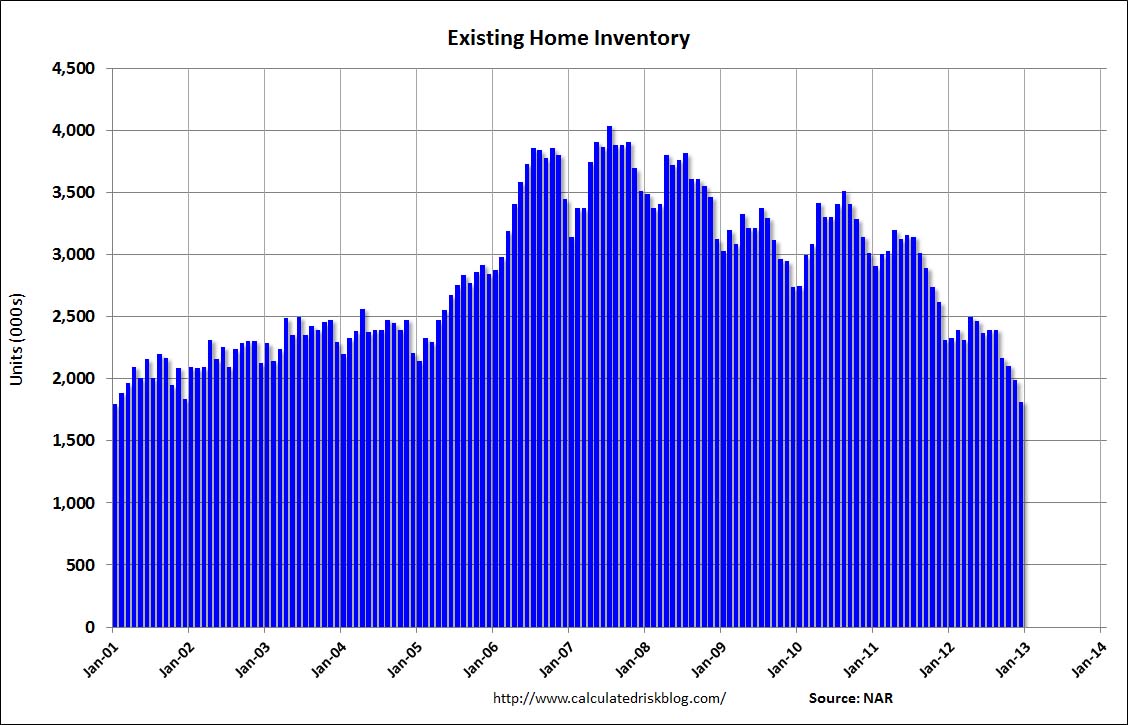 According to the NAR, inventory declined to 1.82 million in December down from 1.99 million in November. This is the lowest level of inventory since January 2001. Inventory is not seasonally adjusted, and usually inventory decreases from the seasonal high in mid-summer to the seasonal lows in December and January.
The last graph shows the year-over-year (YoY) change in reported existing home inventory and months-of-supply. Since inventory is not seasonally adjusted, it really helps to look at the YoY change. Note: Months-of-supply is based on the seasonally adjusted sales and not seasonally adjusted inventory.
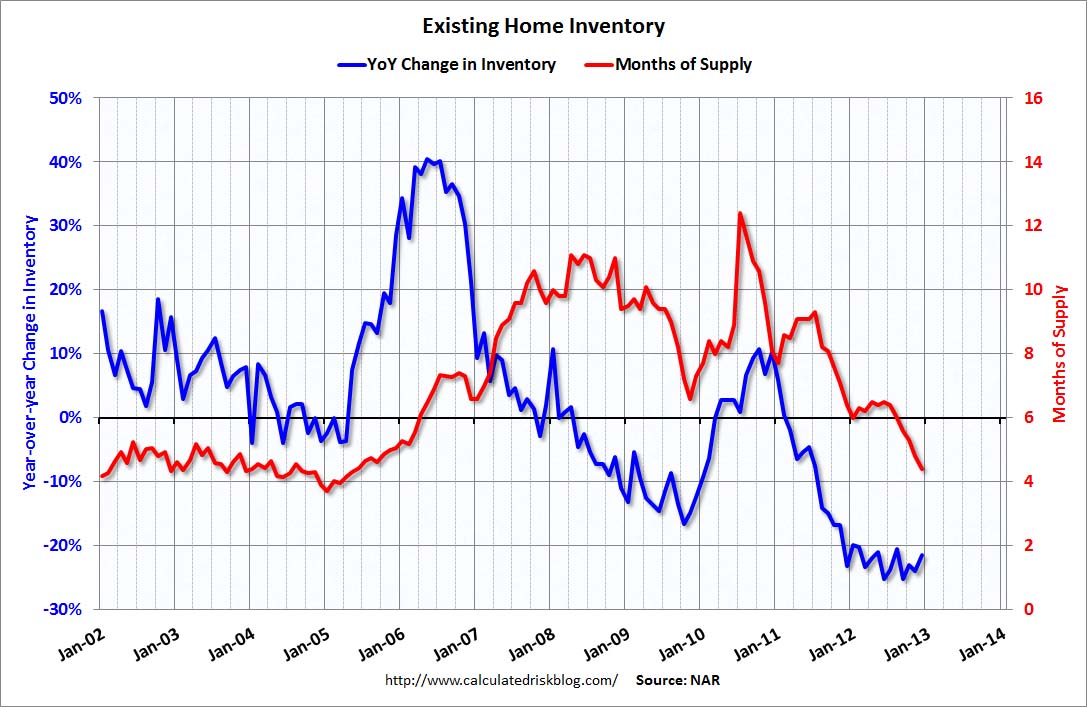 Inventory decreased 21.6% year-over-year in December from December 2011. This is the 22nd consecutive month with a YoY decrease in inventory.
Months of supply declined to 4.4 months in December, the lowest level since May 2005.
This was below expectations of sales of 5.10 million, but right at Tom Lawler’s forecast. For existing home sales, the key number is inventory – and the sharp year-over-year decline in inventory is a positive for housing. I’ll have more later …
All current Existing Home Sales graphs