David Andolfatto has a reply to my recent post.
The BLS data show housing prices rising by 10% after housing prices peaked? Not sure I understand this claim. I thought that the price of housing services entered into the CPI, not house prices directly. In any case, it would have been nice to have been provided with an alternative price index.
Yes, the BLS measures housing prices by looking at the cost of housing services, not the price of houses. That was my point. Why should the price of “housing services” be put in a model that focuses on issues such as employment and output, rather than the price of new houses. That makes no sense to me. Labor is used in building new houses. Very little labor is involved in housing services from older houses. Which house price index better explains the path of housing construction over the past 10 years?
After I wrote:
But even if the data were accurate, prices are the wrong variable, and models that suggest PLT is equivalent to NGDPLT are simply wrong. Indeed one of the strongest arguments for NGDPLT is that it does better when productivity growth is unstable. And productivity growth in America is unstable.
David responded:
Scott, I hate to break this to you but: all models are wrong in the sense that they are abstract representations of reality. Perhaps you mean “wrong” in the sense that any model that displays such an equivalence necessarily does not fit the data? If so, what evidence do you have that supports this claim?
To put this in context, David had argued that some models showed that PLT is almost indistinguishable from NGDPLT. He went on to argue that this was especially true if productivity growth was stable. I agree that there are scenarios where the two policies are almost identical. But productivity growth in the US is not stable. Whenever there is a shift in the AS curve, a policy of PLT will yield a different result from a policy of NGDPLT. In other words the burden of proof is on Andolfatto. One can come up with all sorts of models. Tell me why I should be interested in models that predict almost identical effects from PLT and NGDPLT. If NGDPLT is advocated as a policy that adapts better to shifts in productivity (and it is), why should I reject it on the grounds that it isn’t much different from PLT in models where productivity is stable?
By the way, Miles Kimball, who has some kind words to offer your crowd, claims here that the NGDP target has to be adjusted for changes in productivity growth. But maybe you have some different model in mind? Where does this model live?
Yes I do, and the model lives here. (Without the annoying math. I don’t think mathematical macro models are useful, I gather David doesn’t agree.) Kimball simply asserts that we should want to adjust for productivity changes in order to stabilize inflation. But NGDPLT proponents argue that the whole point of the policy is to destabilize inflation. A stable inflation rate is bad for the welfare of the economy. First because it leads to greater instability in output, and second, because even the welfare costs of inflation itself are greater with a stable inflation rate than a stable NGDP growth rate. Kimball doesn’t seem aware of these arguments, so he assumes that market monetarists simply made a mistake.
I am not sure why a call for “fiscal stimulus” in late 2008 and early 2009 would have been “madness.” The PCE price-level peaked in July 2008 and fell sharply in late 2008 and early 2009 (largely reflecting the collapse in energy prices).
That’s a defensible view, but I still tend to doubt that policy was on target from the Fed’s perspective. I can certain point to statements like NY Fed President Dudley’s recent remark that in retrospect Fed policy should have been easier in 2009. If Andolfatto was correct, I can’t imagine why the Fed would not be pleased with the path of AD in 2009. I’d guess that if Andolfatto visited the Fed and claimed that nominal spending and prices were right were the Fed wanted them in 2009-13, he would meet a lot of resistance. But obviously that’s a judgment call on my part. Some might agree with him.
Andolfatto then shows that changing the trend line in the way I suggested made almost no difference. My mistake. But I would still insist that the trend line is very unreliable. Obviously one could draw other trend lines that are reasonably good fits, just not quite as good as Andolfatto’s, and yet would lead to radically different conclusions. To avoid a wild goose chase, with everyone wasting lots of time, just consider a trend line running through the initial point and the September 2008 level of prices. That trend line would have an average inflation rate of 2.3% instead of 2.09%, and would be well above the actual price level since 2008. I’m not saying that’s the “right one”, it probably isn’t. But when the Fed met in September 2008 they decided not to change policy, and left rates at 2%. They cited equal risks of inflation and recession. That’s all consistent with my view that the Fed did not want lower AD as of September 2008. So it’s not obviously less reflective of Fed views than the trend line drawn by David.
A counterargument is that 2008 prices were a bubble, with high gasoline prices. But gasoline prices are nearly back up to September 2008 levels, and it no longer looks like a bubble. In retrospect it is the very low gasoline prices of 2009, the low overall price level of 2009 that looks the like outlier. Call it a “negative bubble” if you wish. Two dollar gas and an S&P500 at 700. That’s another way of saying that core inflation has run below 2% over the past 5 years.
I said:
If PLT and NGDPLT really were similar policies, then why does NGDP look far below trend since 2008, while the price level (according to Andolfatto, but I have my doubts) is right on trend?
And Andolfatto responded:
That would be because the RGDP is below trend. And there are many reasons why RGDP may be below trend that are independent of the conduct of monetary policy.
I tend to forget that not everyone takes it as a given that low levels of AD have depressed output since 2008. So his point is well taken. Of course I could cite lots of people, including the Miles Kimbell post that David cited, as making strong arguments that inadequate demand has depressed RGDP in recent years.
On the other hand, let’s suppose we did NGDP targeting instead of PLT. And let’s suppose that RGDP has been depressed for reasons having nothing to do with monetary policy. Obviously NGDP growth in recent years would have been much higher under NGDPLT than PLT, which suggests (by assumption) that the price level would also have been quite a bit higher. At a minimum that casts doubt on the hypothesis that PLT and NGDP would have produced similar results.
One final point. In his first post David makes the following claim:
Seems to me that they are just asking for more price inflation and wishfully hoping that some of the subsequent rise in NGDP will take the form of real income.
There might be a sense in which this is true, but I think this it is misleading in two ways:
1. I was an inflation hawk in the 1970s, and have never changed my views. Conditions have changed. Most of the other market monetarists have similar backgrounds. Most of us are not Keynesians looking for a cloak to hide our secret inflationist tendencies. We sincerely favor NGDPLT, and not higher inflation. Personally, I don’t think inflation even matters. All the so-called welfare costs of inflation are more closely correlated with NGDP growth anyway.
2. The Fed denies it is engaged in PLT, and they certainly do not publically adhere to the target path hypothesized by Andolfatto. Instead they inflation target using the PCE. Right now PCE inflation is running 1.4%, or 1.2% for the more reliable core PCE. That’s well below the Fed’s target, and they have no strategy to bring inflation back up to target. They are about to tighten monetary policy despite forecasts that they will continue to fall short of their inflation and employment objectives. One could just as well argue that those who do not favor easier money are “disinflationists” who oppose the Fed’s policy of “stable prices,” defined at 2% PCE inflation.
As far as my “hope” for more real income, I’d like to point out that when unemployment was 10% in 2009 I claimed it was far above the natural rate. That was obviously an implied prediction that unemployment would fall with even halfway decent NGDP growth. I might have been wrong. The French unemployment rate really did stick at 10% after the two oil shock recessions. Obama could have made us like France, and I would have been wrong. But I was right, and unemployment is now down to 7.4%. That’s not to say Obama has not moved us 10% or 20% in the direction of France, and raised our natural rate of unemployment by 0.5% or 1.0%. I think he has. But surely it’s now pretty clear that much of the problem in 2009 was inadequate AD.
And as always, if we had the Fed create and subsidize trading in RGDP and NGDP futures markets, which it could do at trivial cost, we would already know the answer to these important questions. We could look at the real time response of expectations to monetary policy surprises. But I’m the member of a brain dead profession, so we don’t have those markets.
(Of course the brain dead remark is not aimed at David, but rather those economists who oppose low cost policies that would yield valuable market signals.)
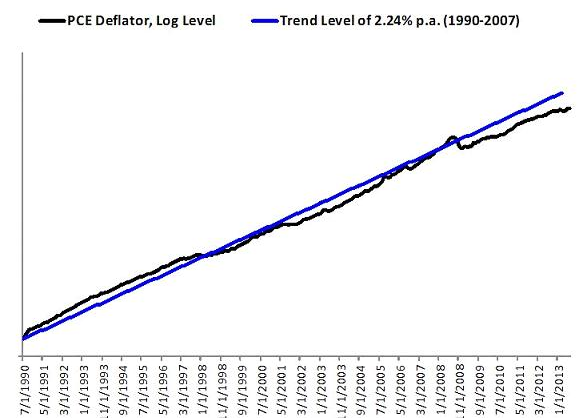
Update: Michael Darda to the rescue, with a very plausible trend line that runs through the cyclical peaks of 1990 and 2007: