I have had a series of posts (one, two) in response to Simon Wren-Lewis‘ post on an aggregate demand constraint. My posts give another version of his model putting real wages on the y-axis and Qty labor on the x-axis. I put labor share on the y-axis and employment rate on the x-axis. I make these changes based on the following equations.
Labor share = real wages/productivity
Employment = Qty labor/labor force
So labor share is positively related to real wages… and employment rate is positively related to Qty labor. (I convert the labor share index into an effective labor share by multiplying by 0.762.)
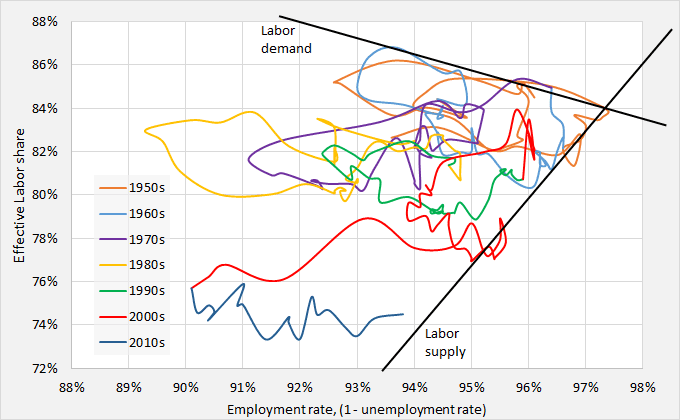
In the second post, I posted this graph of data since the 1950s.
As labor share has dropped overtime, the model suggests that the employment rate has a lower and lower limit due to the sloping labor supply curve.
But now I want to add some views about the labor demand curve. The drop in labor share may actually be a drop in the labor demand curve in the model.
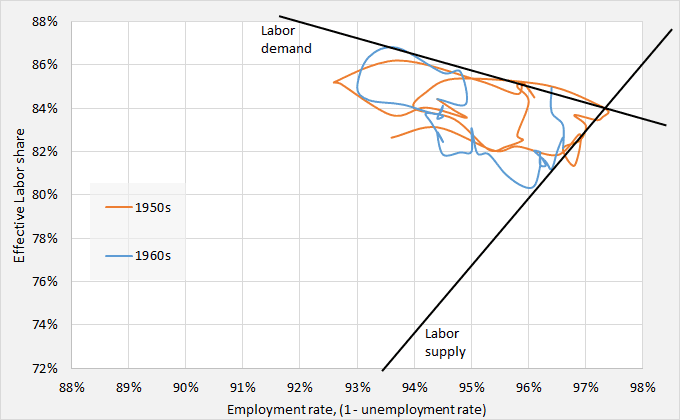
The model for the 1950s and 1960s. We see a boundary for the labor market in terms of supply and demand. I will include these lines in the following graphs as reference points.
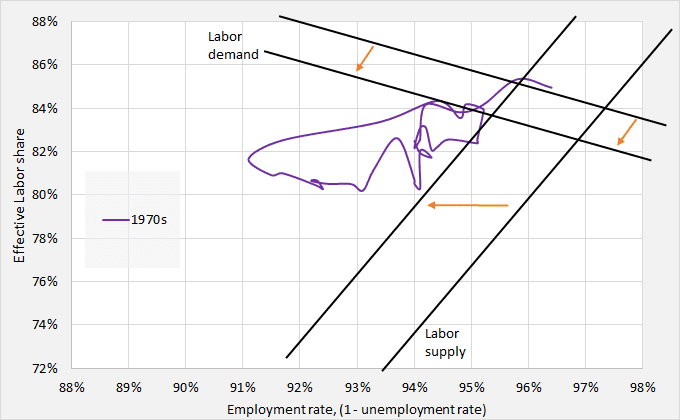
The model for the 1970s. We see that labor demand curve shifted down and the labor supply curve shifted left. In the following graphs, we will see the labor demand curve continuing to shift downward. Business is basically less willing to demand labor at any given level of sharing revenues with labor. The labor supply curve may have shifted left due to the baby boomers and women entering the labor force creating the potential for more unemployed workers at any given level of labor share.
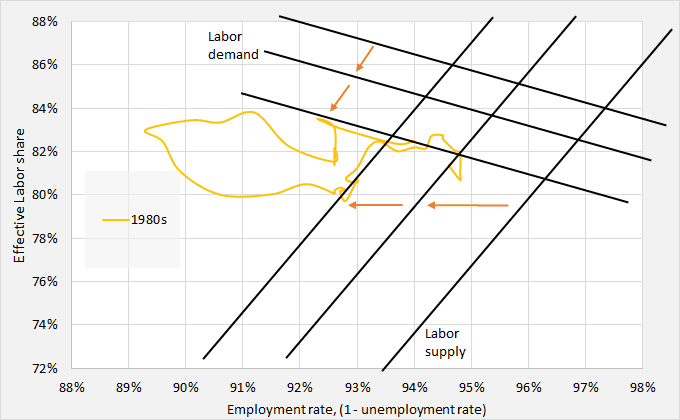
The model for the 1980s. We see labor demand continuing to fall. We see labor supply continuing to represent more potential for unemployment especially due to the manufactured recession by Paul Volcker.
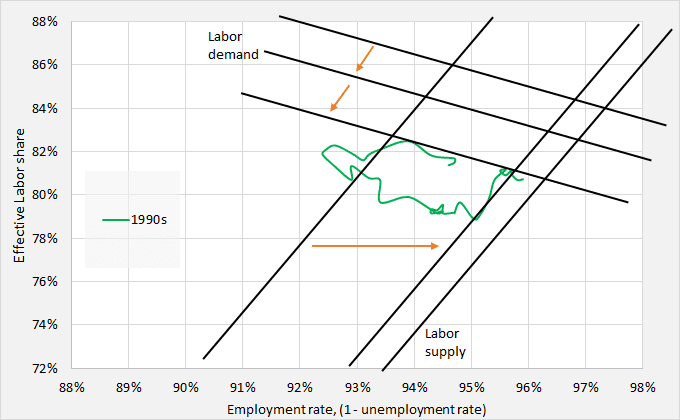
The model for the 1990s. Labor demand stayed the same from the 1980s, but labor supply shifted back right.
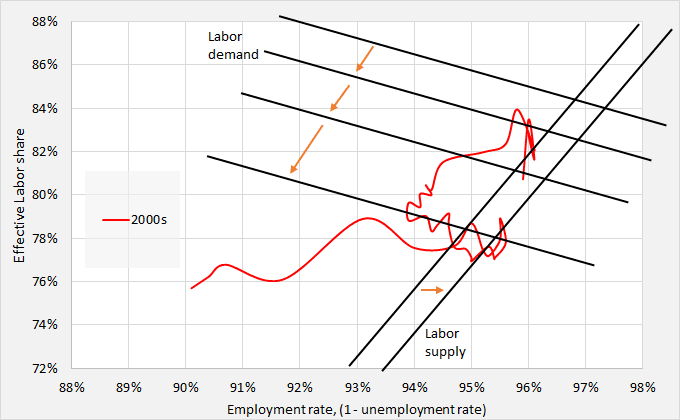
The model for the 2000s. After a surge in labor share around the turn of the century, employment rose. Then labor demand fell through the 2001 recession, which explains the slow recovery of employment. Labor supply returned to its original point from the 1950s and 1960s.
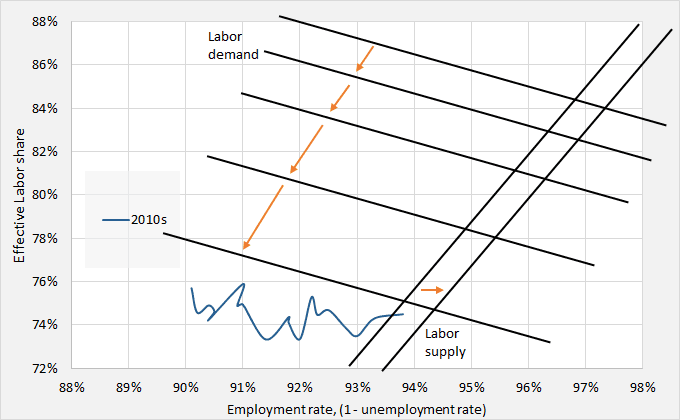
The model for the 2010s. Labor demand has fallen much more since the crisis. Just like the 2001 recession, this fall in labor demand explains the slow recovery of labor after the crisis. Lower labor share represents a lack of valuing and demanding labor. Business is less willing to share its revenues with labor. Labor supply looks to have the same curve as it did in the 1950s and 1960s.
A falling labor share leads to a tighter effective demand constraint. Yet, the real problem in the labor market is labor demand, not labor supply. Lower labor demand is creating a tighter effective demand by including less labor in the national income.
The concern going forward is whether labor demand will continue falling. That has been the pattern for decades. The result would be an even higher natural rate of unemployment.
