What is the primary error in macroeconomics? Potential output… and this error is huge. The measure of potential output is the foundation for many calculations.
- Natural real interest rate
- Natural level of unemployment
- Monetary policy
- Slack
If you get these wrong, there will be problems. Paul Krugman wrote an article for the IMF, Increasing Demand. He writes…
“First, we don’t really know how far below capacity we are operating… Nobody knows—”
How wrong has macroeconomics been? Well, I am going to compare the CBO projection of potential real GDP with my own calculation of potential from my Effective Demand research.
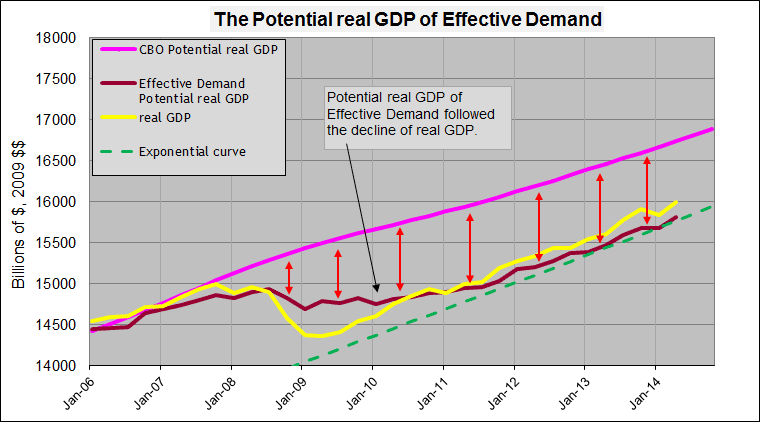
As real GDP declined back in 2008, the CBO was not adjusting their projection of potential (pink line). Whereas my calculation (dark red line) moved horizontal for 3 years. My calculation showed that potential real GDP dropped to a lower trend line… a lower “New Normal”.
The red arrowed lines show the discrepancy between my view of potential and the view of all major economists since the crisis. The discrepancy is huge and started early. The macroeconomic discourse has been based on this major error since the beginning… and the CBO downward revisions of potential have not cleared the error.
Assume for a second that my calculation of potential is correct. Then you realize that
- monetary policy has been misguided.
- imbalances have been building from erroneous policy for 5 years.
- Larry Summers’ projection of a negative natural real interest rate is misguided.
- secular stagnation is just dropping to a new trend line.
I will make two more comparisons of the CBO potential real GDP and the effective demand potential.
Volcker Recession
During the Volcker recession, real GDP dropped quite a bit. However, the potential real GDP from the effective demand research did not drop to a new lower normal. It followed parallel to the CBO projection… and then moved with real GDP after the recession. The economy had a normal recovery from the recession.
2001 Recession
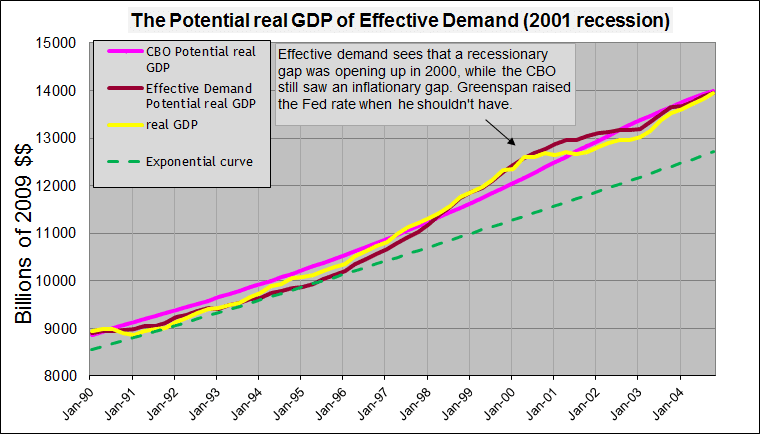
In 2000, real GDP (yellow) started to flatten and fall. While the CBO was raising their projection of potential (pink), my effective demand potential (dark red) was beginning to flatten as well. Eventually all lines come back together in 2004.
But the important point is that potential real GDP gives a measure of slack in the economy (unused utilization of labor and capital). This measure of slack is critical for monetary policy. In 2000, the effective demand potential was showing that slack was increasing into a recessionary gap (real GDP less than potential). However, the CBO was still showing a high inflationary gap (real GDP more than potential). Greenspan saw the inflationary gap, saw inflation rising in 2000, expected more inflation and raised the Fed rate. The recessionary gap started to form months later. The effective demand potential said that he should not have raised the Fed rate like he did.
Carl Walsh wrote in 2001 for the Federal Reserve Bank of San Francisco in an article titled, The Science (and Art) of Monetary Policy...
“As the economy grew rapidly during the second half of the decade (1990′s), economists were uncertain whether real output was rising above potential, in which case interest rate hikes would be called for, or whether both actual and potential output were growing more rapidly, leaving the output gap stable.”
The ED potential GDP showed the latter; potential was rising leaving the output gap stable.
Conclusion
In my view, Volcker was not misled by the CBO’s projection of potential. Yet Greenspan in 2000 was misled… Now, the Fed and major economists have been hugely misled for 5 years by a CBO projection of potential that is much too high… Years from now, macroeconomics will look back and recognize this great error.
Note: The equation for Effective Demand potential real GDP…
ED Potential real GDP = real GDP – $3.4 trillion * (capacity utilization/(index of non-farm business labor share * 0.762) – 1)


