Did you know that most market bottoms form with extreme increases in volume?
Go take a look at March of 2021 or 2009 if you don’t believe us.
The problem is market tops don’t follow those same rules.
But what if there was another way to measure extreme interest in the market?
That’s where our TrackstarIQ Data comes in.
And we want to show you how to use it to enhance your analysis.
Take a look at the following chart that shows pageviews for the four major market ETFs over the last two months.
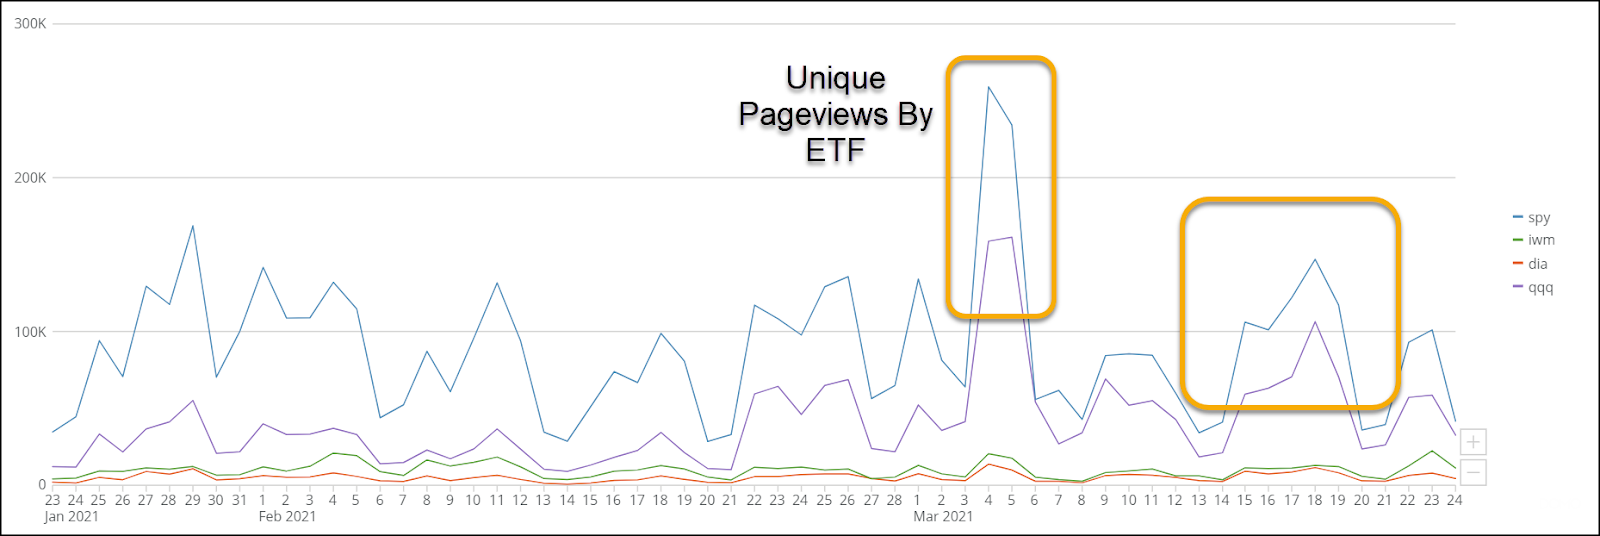
Check out the highlighted areas.
Those points show substantially increased search activity across all the ETFs.
They also coincided with recent turns in the market.
Now, you probably think we’re cherry-picking here.
But give us a few minutes to explain not only why we selected these points, but how you can incorporate TrackstarIQ data into your market analysis.
Understanding market sentiment
There’s a saying among traders – buy the rumor and sell the news.
What they really mean is buy before everyone else and sell when popularity peaks.
Think about Tesla (TSLA).
Nearly every week it tops the searches for our TrackstarIQ Data among institutional advisors and retail.
If you bought shares of Tesla a decade ago, way before they were popular, you’d be up some absurd amount like 15,000%.
Chances are the next decade won’t turn that kind of profit again for Tesla.
This phenomenon tends to hold true with market sentiment.
Market sentiment, as we’re defining it here, is the directional feeling of the market.
That is to say it’s not just bullish or bearish, but HOW bullish or bearish the market is.
And it turns out that markets tend to peak and bottom at extremes in sentiment.
Incorporating TrackstarIQ into your analysis
If you want to find tops and bottoms in the broader market there are numerous methods out there. Among the more popular are:
- Extremes in the S&P 500 Volatility Index (VIX)
- Advancing vs declining issues
- Daily volume
None of these independently provides a definitive signal for a market turn.
Taken together, they can help you determine when markets are near extremes.
And that’s where TrackstarIQ comes in.
Think of it as another piece to the puzzle.
By itself, it won’t necessarily confirm a market bottom or top.
Used in conjunction with a broader analysis, it can give you a more comprehensive picture of the market.
A practical example
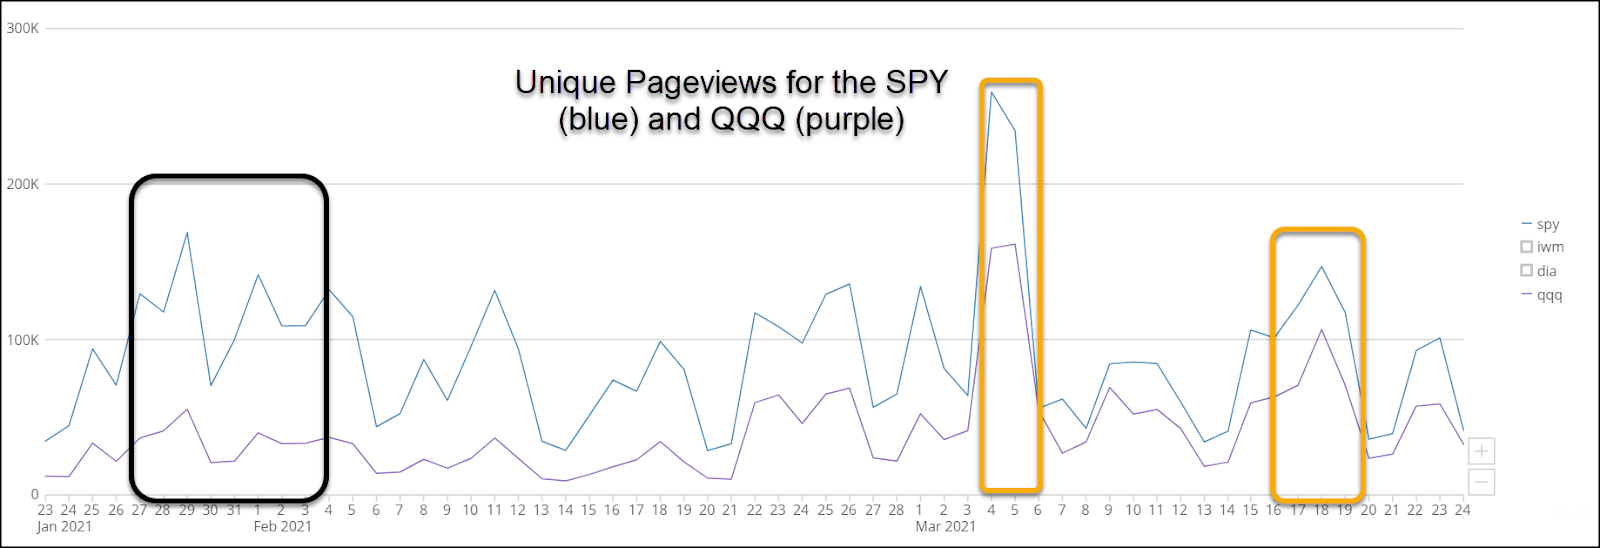
Let’s take a look at two sets of TrackstarIQ data.
This first graph shows the pageviews for the two more popular ETFs, the S&P 500 SPY and the Nasdaq 100 QQQ.
Next, we have the same thing but for the Russell 2000 IWM and Dow Jones Industrial Average DIA.
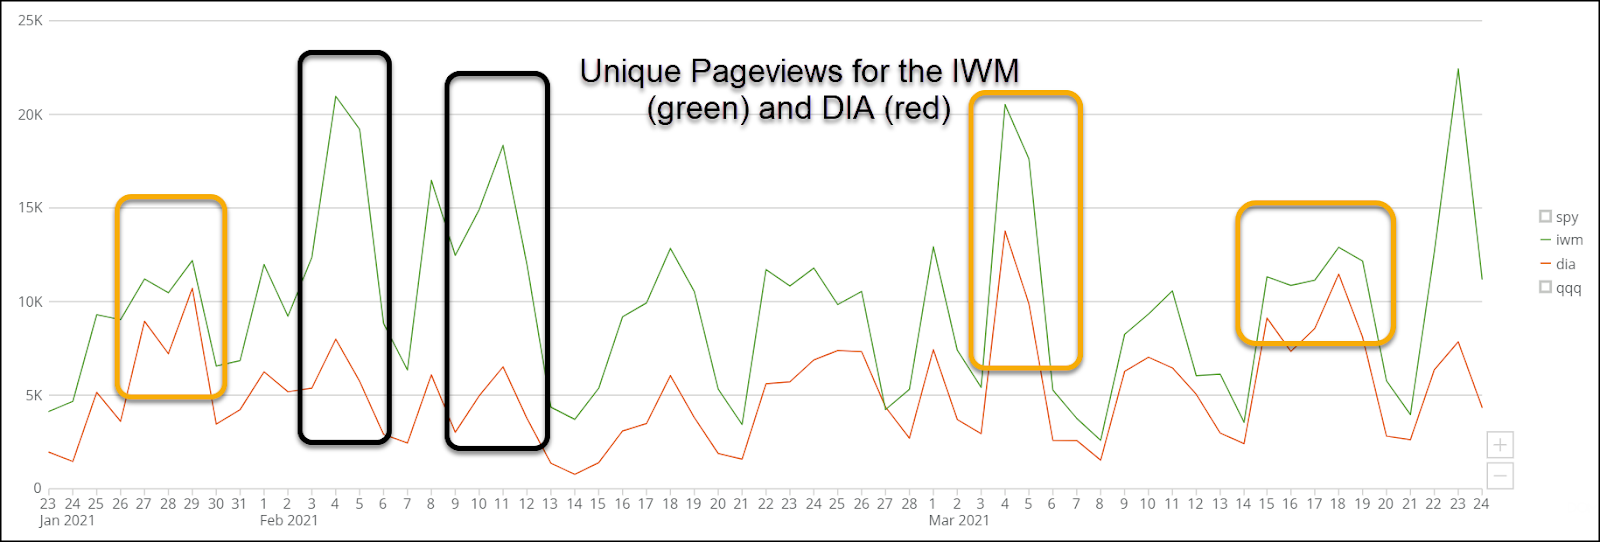
In each, we highlighted sections where both indexes spiked in orange boxes. When only one index spiked, we drew a black box.
Notice how the orange boxes in both areas only align at two points – early March and mid-late march.
If you look at a chart of the market, what you’ll find is the indexes bottomed out around early March.
And so far, they appear to have peaked in mid-late March.
Let’s look specifically at the early March point. What you’ll also find is that as the SPY bottomed out, volume increased as well.
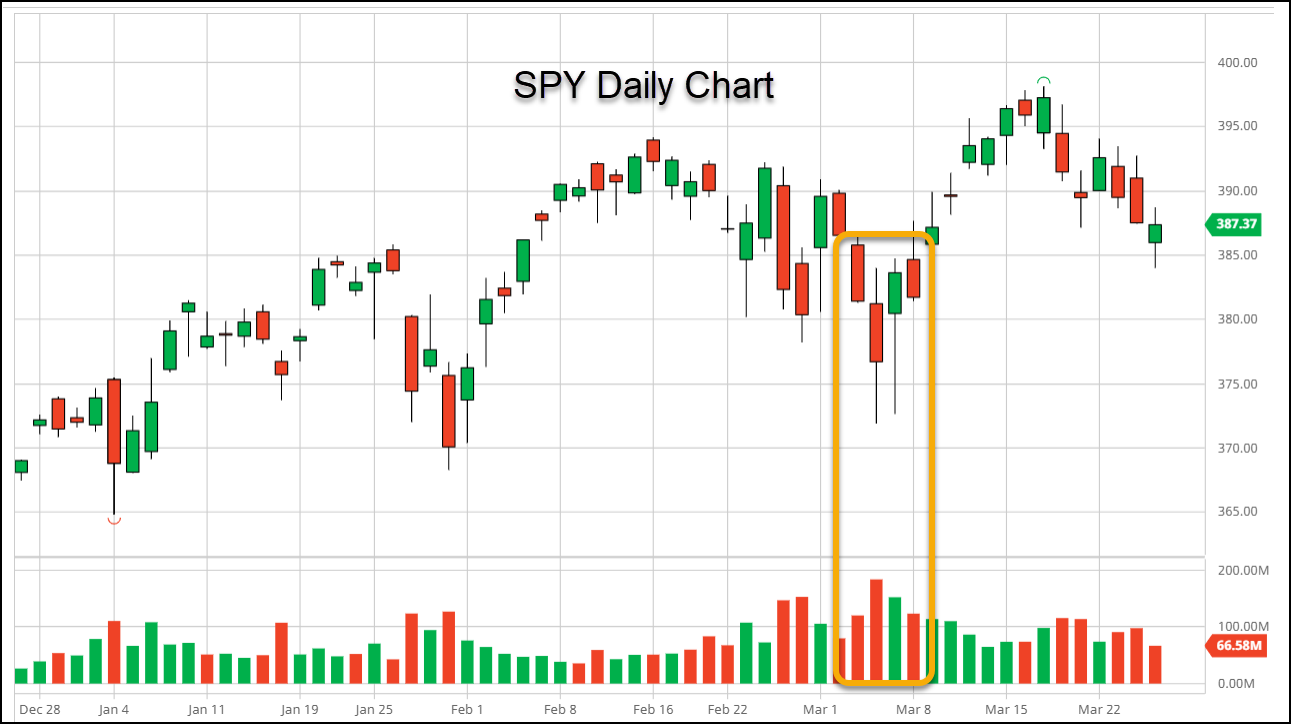
And yes, the VIX also peaked around that time.
Not a foolproof guarantee
Let’s make one thing clear.
None of this is a full-proof guarantee.
Trading and investing are exercises in probabilities.
You could invest in a company with the greatest value in the world.
But if the market has other plans (like a global pandemic hits), it’s out of your control.
You can only control the decisions you make.
So try to make the best ones possible
The bottom line
TrackstarIQ Data can provide valuable insights to help you make informed investment decisions.
Our goal is to give you usable data and insights you can’t find anywhere else.

