Summer was great … as long as you didn’t spend your days staring at charts, because nothing happened there.
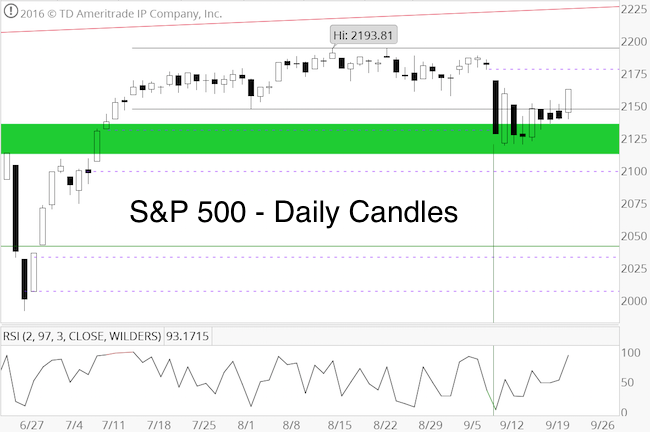
From July 11 – September 8, stocks didn’t go anywhere. We didn’t even bother trading stocks.
But all boring periods must come to an end. The August 28 Profit Radar Report stated that:
“What we are focused on for now is the most likely scope of any pullback. We prefer to see lower prices (the lower the better) and will start to leg into long positions at different levels.”
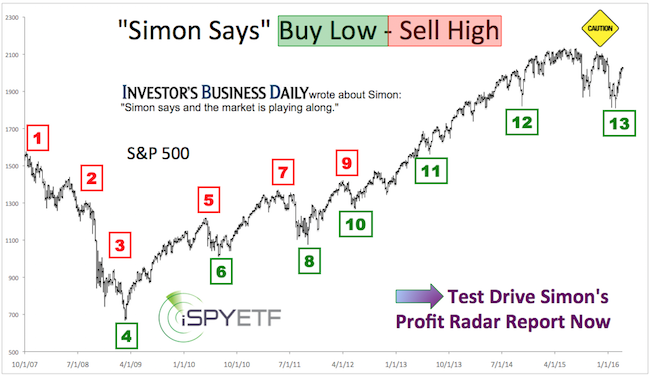
Barron’s rates iSPYETF as “trader with a good track record” and Investor’s Bussines Daily says “When Simon says, the market listens.” Find out why Barron’s and IBD endorse Simon Maierhofer’s Profit Radar Report.
Since late July, our first buy trigger has been waiting at S&P 2,140 (=SPY 214.20). Months of patience (and not chasing the up side) paid off on September 9 when the S&P 500 dropped below 2,140.
Since buying SPY on September 9, we also bought the iShares Russell 2000 ETF (IWM) and the VelocityShares Daily Inverse VIX ETN (XIV). This article explains why shorting the VIX via XIV is such an attractive trade: The Spectacular VIX Tailwind Trade
We started to leg into various long positions because the weight of evidences suggests higher prices for the remainder of 2016.
However, although the S&P (and Russell 2000) reached our first down side target, the performance since hasn’t been too confidence inspiring. It is missing the escape velocity we saw in February and June.
In February, the S&P bottomed near 1,800 and experienced a breadth thrust (we discussed this here: 2016 Bear Market Risk is Zero Based on this Rare but Consistent Pattern).
There was also a breadth thrust right after the Brexit low in June. This kickoff rally along with two longer-term projections was detailed here: Stock Market Melt-Up Alert?

In the spirit of risk management (a bird in the hand is better than two in the bush), we trimmed our positions in XIV and IWM and cashed in some profits. Although today’s spike looks good, 2-day RSI is reaching overbought, and seasonality tends to be weak this time of year.
For now, we are happy to have bought SPY, IWM and XIV near the September lows. When stocks are up, it’s better to be long and worry about a possible relapse than being in cash (or worse short) and worry about having missed the bottom. We can now play with ‘house money.’
Continued S&P 500 updates are available via the Profit Radar Report.
Simon Maierhofer is the founder of iSPYETF and the publisher of the Profit Radar Report. Barron’s rated iSPYETF as a “trader with a good track record” (click here for Barron’s profile of the Profit Radar Report). The Profit Radar Report presents complex market analysis (S&P 500, Dow Jones, gold, silver, euro and bonds) in an easy format. Technical analysis, sentiment indicators, seasonal patterns and common sense are all wrapped up into two or more easy-to-read weekly updates. All Profit Radar Report recommendations resulted in a 59.51% net gain in 2013, 17.59% in 2014, and 24.52% in 2015.
Follow Simon on Twitter @ iSPYETF or sign up for the FREE iSPYETF Newsletter to get actionable ETF trade ideas delivered for free.
