The Fed’s Household Debt Service ratio through Q2 2016 was released last week: Household Debt Service and Financial Obligations Ratios. I used to track this quarterly back in 2005 and 2006 to point out that households were taking on excessive financial obligations.
These ratios show the percent of disposable personal income (DPI) dedicated to debt service (DSR) and financial obligations (FOR) for households. Note: The Fed changed the release in Q3 2013.
The household Debt Service Ratio (DSR) is the ratio of total required household debt payments to total disposable income.
The DSR is divided into two parts. The Mortgage DSR is total quarterly required mortgage payments divided by total quarterly disposable personal income. The Consumer DSR is total quarterly scheduled consumer debt payments divided by total quarterly disposable personal income. The Mortgage DSR and the Consumer DSR sum to the DSR.
This data has limited value in terms of absolute numbers, but is useful in looking at trends. Here is a discussion from the Fed:
The limitations of current sources of data make the calculation of the ratio especially difficult. The ideal data set for such a calculation would have the required payments on every loan held by every household in the United States. Such a data set is not available, and thus the calculated series is only an approximation of the debt service ratio faced by households. Nonetheless, this approximation is useful to the extent that, by using the same method and data series over time, it generates a time series that captures the important changes in the household debt service burden.
 Click on graph for larger image.
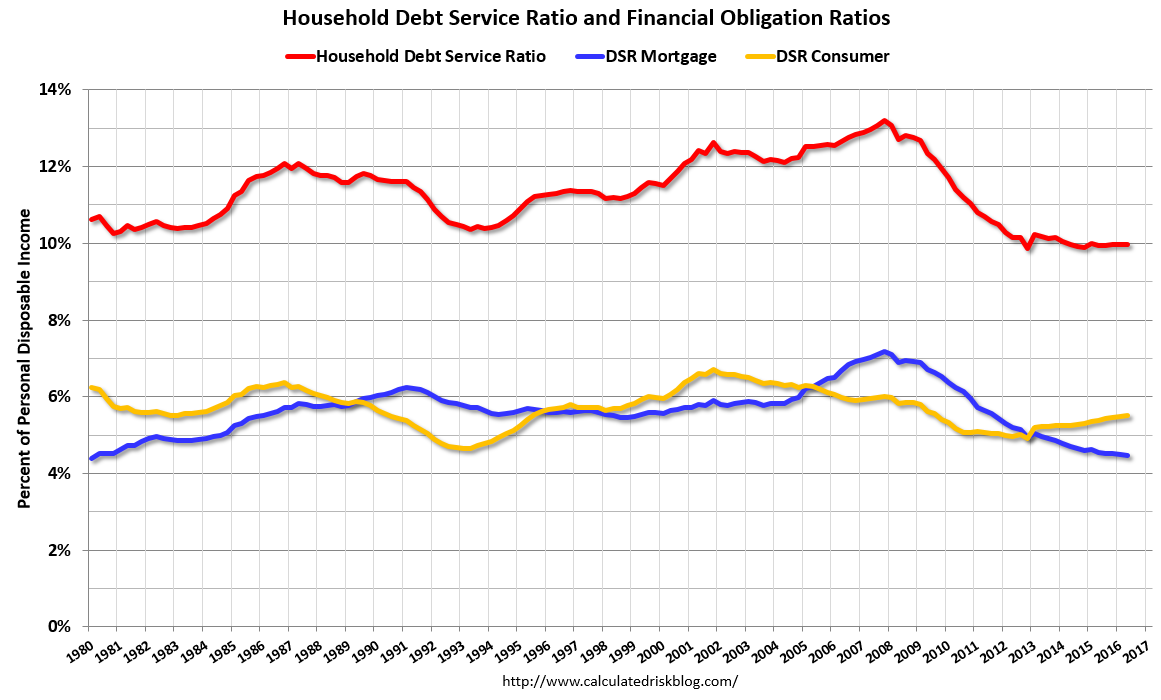
The graph shows the Total Debt Service Ratio (DSR), and the DSR for mortgages (blue) and consumer debt (yellow).
The overall Debt Service Ratio increased slightly in Q2, and has been moving sideways and is near a record low. Note: The financial obligation ratio (FOR) was unchanged in Q2 and is also near a record low (not shown)
The DSR for mortgages (blue) are near the low for the last 35 years. This ratio increased rapidly during the housing bubble, and continued to increase until 2007. With falling interest rates, and less mortgage debt (mostly due to foreclosures), the mortgage ratio has declined significantly.
The consumer debt DSR (yellow) has been increasing for the last three years.
This data suggests aggregate household cash flow has improved.