There are a wide variety of ways of thinking about monetary policy. In this post I’ll use some graphs to illustrate various policy options, with the goal of shedding light on some of the major debates of the past decade.
Let’s start with a shift from a zero percent target path for inflation to a 2% path. Let’s also assume that the Quantity Theory (QT) holds in the long run, in the sense that prices move in proportion to changes in the money supply, other things equal. But in the short run, money demand is negatively correlated with nominal interest rates. (Don’t worry if you don’t like the QT, this example will have anti-QT implications.)
Let’s assume that it is Japan that switches from a zero percent inflation path to a 2% inflation path. Also assume that the new path pushes nominal interest rates up from 0% to 2%. (I.e. assume a zero real rate of interest, for simplicity.) And finally, let’s assume that that demand for base money in Japan is 100% of GDP at zero interest rates and 10% of GDP at 2% nominal interest rates. (Not implausible assumptions, BTW.)
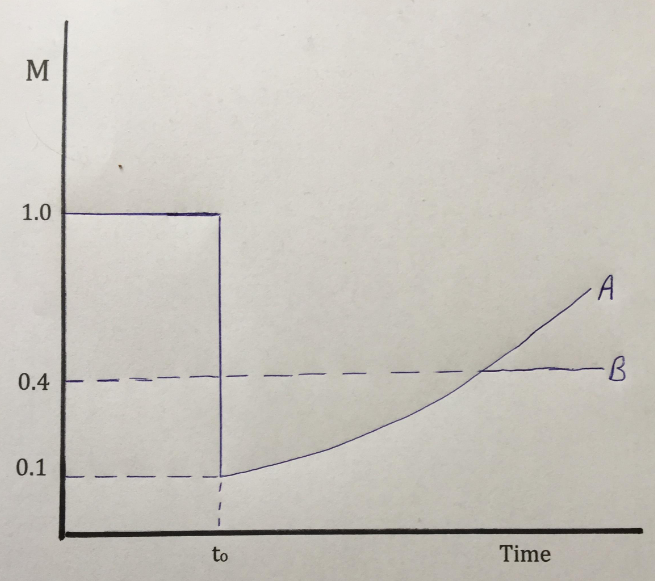
In the following graph, path A shows the path of the money supply that would push inflation from 0% to 2%, without any discontinuous change in the price level at the point where the policy change occurs.

Even though the money supply plunges by 90% at time=0, the price level does not show any immediate change. The Japanese suddenly prefer to hold much smaller cash balances, because the opportunity cost of holding base money has risen from zero to 2%/year.
Once money demand has fallen by 90%, it levels off. From that point forward, the BOJ must raise the money supply at 2%/year in order to generate 2% annual inflation. It takes 72 years for the price level to quadruple, but even then the money supply remains 60% below the level just before the change in policy.
So far I’m assuming that everything works smoothly. The policy change is credible, and is expected to persist forever. The Japanese attitude toward money changes immediately, to become more like the Australian attitude. Japanese salarymen suddenly start refusing overtime, and instead go home and put on shorts, throw a few shrimp on the backyard barbie, and make rude jokes about Sheilas.
That’s already a pretty heavy lift, but it gets much worse. Let’s suppose that the money supply follows path A for 72 years, and then is expected to level off (as in path B). What then?
In that case, everything changes even today, at time=0. The hypothesis that the BOJ could reduce the money supply by 90% and at the same time start on a path of 2% inflation is entirely dependent on the public believing that this new policy will last forever. If it lasts for “only” 72 years, the effect will be radically different.
Under path A, the price level is four times higher after 72 years. Under path B it is 60% lower than at time=0. That’s because path B leads to zero money growth and zero inflation in the long run. That means that 72 years from today, real money demand will be just as high as before the t=0 policy shift, and since the money supply is assumed to be 60% lower, the price level will also be 60% lower. The path of prices over that 72 year period will also be vastly different, but I’m not smart enough to show exactly how different.
The bottom line is that it’s dangerous to engage in money supply targeting. The path for the money supply that might achieve success with 100% credibility, could lead to total failure if it’s 100% credible for only 72 years, but not thereafter. (I believe Nick Rowe made this point earlier.)
Last year, the yen briefly appreciated on news that Prime Minister Abe might have to leave office due to a corruption scandal, and the next PM was not expected to push as hard for monetary stimulus. Now imagine a scenario where even committing to 72 years of monetary expansion is not enough!
Fortunately, Lars Svensson came up with a “foolproof” escape from a liquidity trap, which does not require any unreasonable credibility assumptions:
Why would this work? The argument proceeds in several steps, to be explained in detail below: (i) It is technically feasible for the central bank to devalue the currency and peg the exchange rate at a level corresponding to an initial real depreciation of the domestic currency relative to the steady state. (ii) If the central bank demonstrates that it both can and wants to hold the peg, the peg will be credible. That is, the private sector will expect the peg to hold in the future. (iii) When the peg is credible, the central bank has to raise the short nominal interest rate above the zero bound to a level corresponding to uncovered interest rate parity. Thus, the economy is formally out of the liquidity trap. In spite of the rise of the nominal interest rate, the long real rate falls, as we shall see. (iv) Since the initial real exchange rate corresponds to a real depreciation of the domestic currency relative to the steady state, the private sector must expect a real appreciation eventually. (v) Expected real appreciation of the currency implies, by real interest parity (2.15) and (2.16), that the long real interest rate is lower. (vi) Furthermore, given the particular crawling peg (3.4), a real appreciation of the domestic currency will arise only if domestic inflation exceeds the inflation target. Therefore, the private sector must expect inflation to eventually rise and even exceed the inflation target.
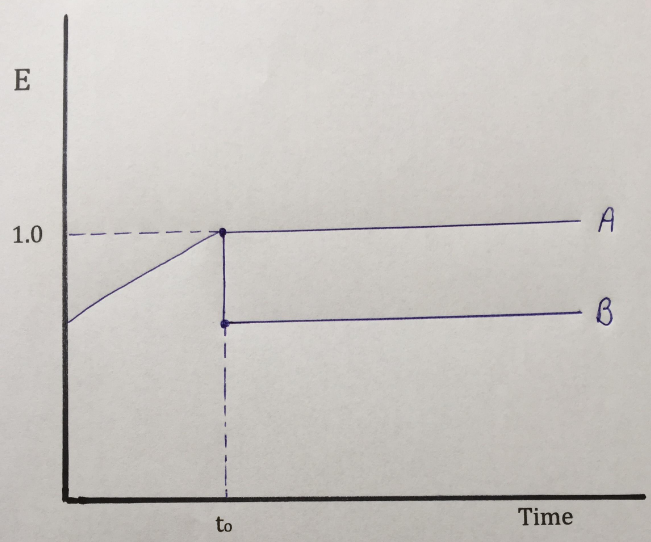
Let’s illustrate his intuition with a time series graph, showing the foreign exchange value of the Japanese yen (priced in US pennies):

Let’s assume the yen had been gradually appreciating before time=0, and then the yen were suddenly pegged to the dollar. During the period of yen appreciation, the Japanese inflation rate would be lower than in the US, on average. If the BOJ pegged the yen to the dollar, then the long run trend rate of inflation in Japan would be similar to the rate in the US. This is illustrated by path A.
Of course PPP does not always hold perfectly, and perhaps Japan needs a bit of “catch-up inflation.” After all, the Japanese economy was somewhat depressed after years of deflation at the time Svensson first developed his proposal in 2000. To make the policy even more “foolproof” you can do a one-time depreciation of the yen, and then peg the exchange rate to the dollar. That gives you a bit more inflation, and insures against a real depreciation in the yen exchange rate from exogenous factors.
It’s actually very likely that under this policy the money supply in Japan would look much like what I showed in the first graph above. But you can’t make the opposite argument. There is no reason to assume that adopting the money supply path shown in the first graph would lead to an exchange rate graph that looks even remotely like what we see in the second graph.
This is why QE by itself is a rather clumsy instrument. What a central bank actually needs to do is commit to do enough QE to hit some sort of price target (such as exchange rates or NGDP futures prices), and if they do so they might not have to do any QE at all (as in the first graph, where they actually reduce the money supply).
Exchange rate targeting has one important advantage over money supply targeting; the money supply is automatically adjusted to reflect the degree to which the public finds the policy target to be credible. If it’s not credible, you inject much more money than if it is credible. You inject enough money to keep exchange rates stable and on target, which is also enough money to accommodate the demand for money under the new policy regime.
Svensson’s proposal is an example of a NeoFisherian monetary policy, a more expansionary monetary policy that is associated with a rise in nominal interest rates, even in the very short run. Therefore it may be useful to use this graphical approach to compare the New Keynesian and NeoFisherian policy options.
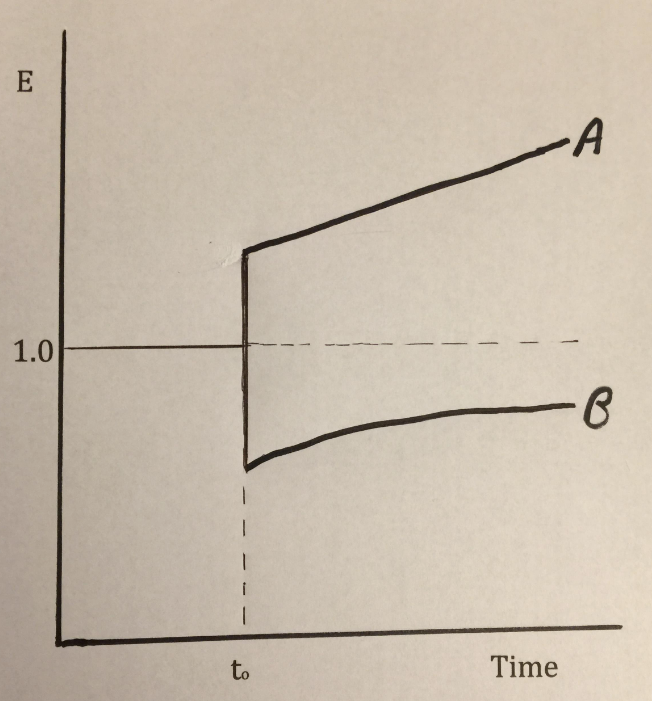
The next graph shows two possible paths for the exchange rate, two very different monetary policies. (Think of a country like Singapore, that uses the exchange rate as its monetary policy instrument.) And yet, as we will see, the change in nominal interest rates may well be identical in the two cases, even though one policy is highly expansionary while the other is highly contractionary.

Path A is a contractionary NeoFisherian monetary policy, sudden currency appreciation with a commitment for even more appreciation in the future. This is effectively what the Swiss National Bank did in January 2015. The franc appreciated and Swiss interest rates fell due to the Fisher effect. (Or the interest parity condition, if you prefer.)
Path B is an expansionary New Keynesian policy, currency depreciation with a commitment to gradually appreciate the currency only part way back to the original level. This is “Dornbusch overshooting”, and is effectively what the US did when it announced QE1 in March 2009. The dollar fell 6 cents against the euro on the day of the announcement.
Importantly, both monetary policies are “low interest rate policies”, even as one is highly expansionary and one is highly contractionary. That’s because both feature expected currency appreciation after the initial shock, and interest parity implies that this depresses domestic interest rates.
Some people are tempted to argue that the direct effect of low rates is always expansionary; while in the NeoFisherian case this effect is offset by currency appreciation. But that’s wrong, there is no direct effect of interest rates. Changes in market interest rates are always the effect of some more fundamental monetary operation, such as open market sales, discount loans, IOR, reserve requirements, forward guidance, etc. It’s hard, but you have to stop thinking about changing market interest rates as a policy, and instead think about market interest rates as the effect of various policies.
I hope these exercises are of more than academic interest. In my view, they help us to better understand that the sort of monetary regimes that are effective have several things in common:
First, they target a price, such as the price of gold, the price of foreign exchange, the price of CPI futures, the price of NGDP futures or some sort of complex mixture of asset prices that are believed to reflect NGDP expectations. (Hopefully not the stock market, which seems to be the current obsession of the Fed.)
Second, the policy does “whatever it takes” to hit the price target. This means that the market determines the needed level of concrete steps, which will depend on the policy’s credibility.
Third, less credible policies will require more concrete steps, and hence more controversial monetary policy actions. Ironically, a clear and strong “whatever it takes” approach will boost policy credibility, and therefore require less aggressive concrete steps than a more timid approach.
Lars Svensson understood these principles back in 2000. Here are the three steps in his foolproof policy (from the 2003 version of the model):
(1) Announce an upward-sloping price-level target path . . . for the domestic price level . . .
(2a) Announce that the currency will be devalued and that the exchange rate will be pegged to a crawling exchange-rate target . . . That is, the central bank makes a commitment to buy and sell unlimited amounts of foreign
currency at the [targeted] exchange rate . . .(3) Then, just do it.
Svensson seems to be a Nike shoe fan, while I prefer Yoda’s version:
Do. Or do not. There is no try.