Hotels: Occupancy Rate Down 9.2% Compared to Same Week in 2019 - InvestingChannel

Hotels: Occupancy Rate Down 9.2% Compared to Same Week in 2019

Note: Since occupancy declined sharply at the onset of the pandemic, CoStar is comparing to 2019.

U.S. hotel performance dipped from the previous week, according to STR‘s latest data through Oct. 2.

26 September through 2 October 2021 (percentage change from comparable week in 2019*):

Occupancy: 61.7% (-9.2%)
• Average daily rate (ADR): US$130.87 (+1.2%)
• Revenue per available room (RevPAR): US$80.78 (-8.2%)

*Due to the steep, pandemic-driven performance declines of 2020, STR is measuring recovery against comparable time periods from 2019.
emphasis added

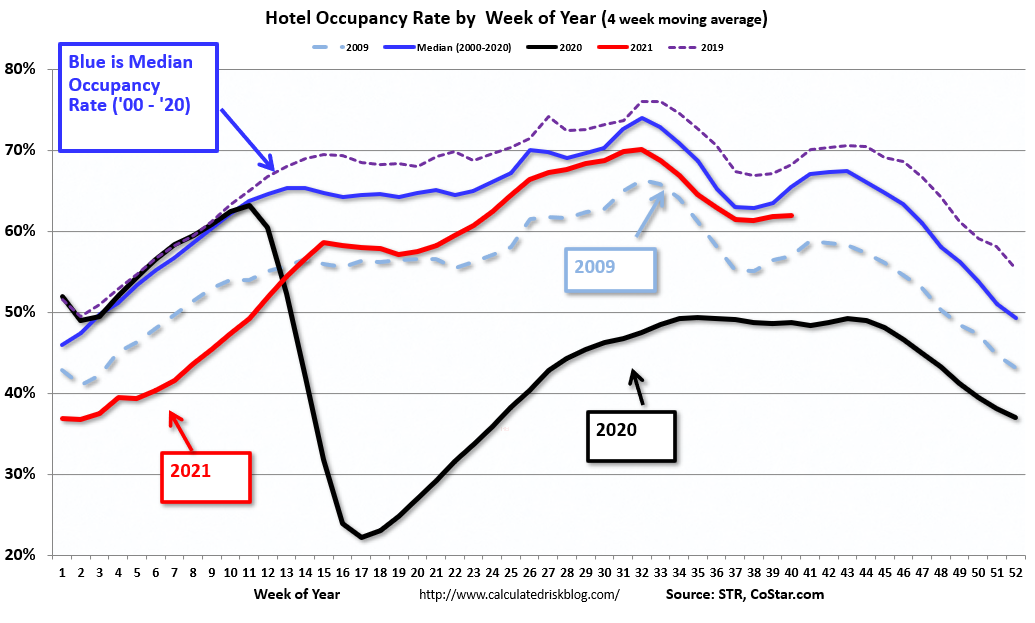
The following graph shows the seasonal pattern for the hotel occupancy rate using the four week average.

Hotel Occupancy RateClick on graph for larger image.

The red line is for 2021, black is 2020, blue is the median, dashed purple is 2019, and dashed light blue is for 2009 (the worst year on record for hotels prior to 2020).

Note: Y-axis doesn’t start at zero to better show the seasonal change.
The Summer months had decent occupancy with solid leisure travel, and occupancy was only off about 7% in July and August compared to 2019.
But it is uncertain what will happen over the next couple of months with business travel.  Usually weekly occupancy increases to around 70% in the weeks following Labor Day due to renewed business travel.

Related posts

Idiocy in Spain: Bank Proposal to Build More Houses, Issue More Mortgages, Despite Massive Inventory and Enormous Drop in Sales

Mish Global Economic Trend Analysis

Sky City: China to Build World’s Tallest Building, 220 Stories, in 90 Days

Mish Global Economic Trend Analysis

It’s No Wonder People Don’t Understand the “Public” Debt

Angry Bear

EU Budget Laugh of the Day “No One Is Discussing Quality”

Mish Global Economic Trend Analysis

Via Barry Ritholtz’s  Big Picture comes this PBS six minute …

Angry Bear

Politics and Specific Policies

Angry Bear