Yes, mortgage rates really moved above 6% yesterday for the first time since 2008. … The average lender is quoting top tier 30yr fixed rates in the 6.25-6.375% range, but as we discussed yesterday, it’s cheaper than normal to buy one’s rate down. That means rates in the high 5’s are still being quoted, but those quotes imply higher upfront costs (aka “points”). [30 year fixed 6.28%]
emphasis added
Wednesday:
• At 7:00 AM ET, The Mortgage Bankers Association (MBA) will release the results for the mortgage purchase applications index.
• At 8:30 AM, Retail sales for May is scheduled to be released. The consensus is for a 0.2% increase in retail sales.
• Also at 8:30 AM, The New York Fed Empire State manufacturing survey for June. The consensus is for a reading of 4.5, up from -11.6.
• At 10:00 AM, The June NAHB homebuilder survey. The consensus is for a reading of 68, down from 69 last month. Any number below 50 indicates that more builders view sales conditions as poor than good.
• At 2:00 PM, FOMC Meeting Announcement. The FOMC is expected to raise the Fed Funds rate by 50bp at this meeting.
• Also at 2:00 PM, FOMC Forecasts This will include the Federal Open Market Committee (FOMC) participants’ projections of the appropriate target federal funds rate along with the quarterly economic projections.
• At 2:30 PM, Fed Chair Jerome Powell holds a press briefing following the FOMC announcement.
On COVID (focus on hospitalizations and deaths):
| COVID Metrics | ||||
|---|---|---|---|---|
| Now | Week Ago |
Goal | ||
| Percent fully Vaccinated | 66.8% | — | ≥70.0%1 | |
| Fully Vaccinated (millions) | 221.8 | — | ≥2321 | |
| New Cases per Day3🚩 | 106,246 | 105,846 | ≤5,0002 | |
| Hospitalized3🚩 | 23,509 | 23,205 | ≤3,0002 | |
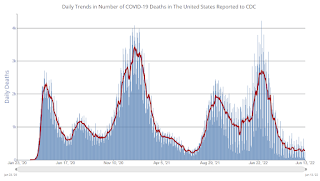
| Deaths per Day3 | 283 | 294 | ≤502 | |
| 1 Minimum to achieve “herd immunity” (estimated between 70% and 85%). 2my goals to stop daily posts, 37-day average for Cases, Currently Hospitalized, and Deaths 🚩 Increasing 7-day average week-over-week for Cases, Hospitalized, and Deaths ✅ Goal met. |
||||
 Click on graph for larger image.
This graph shows the daily (columns) and 7-day average (line) of deaths reported.
New cases have quadrupled from the recent low.