|
Proprietary Data Insights Financial Pros Top Packaged-Food Stock Searches in the Last Month
|
|
Consumer Defensive |
Baby Got Snacks! |
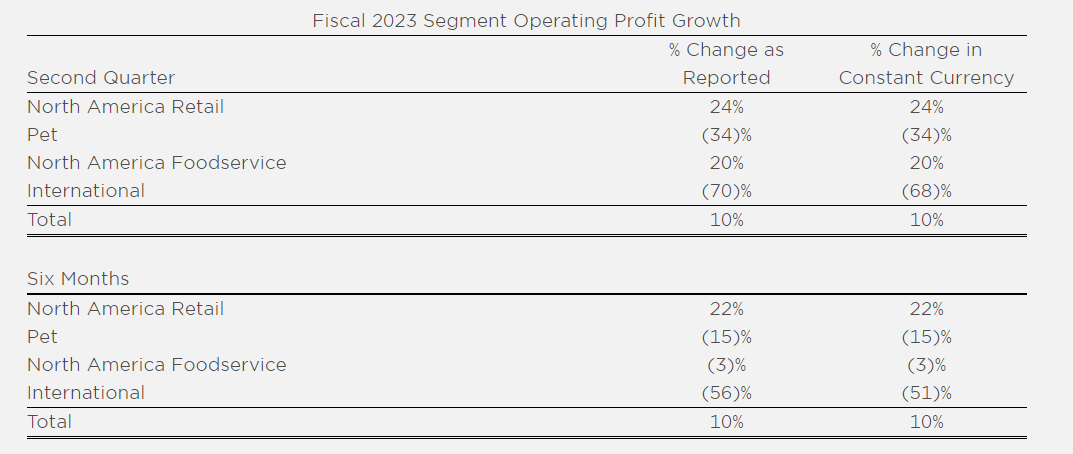
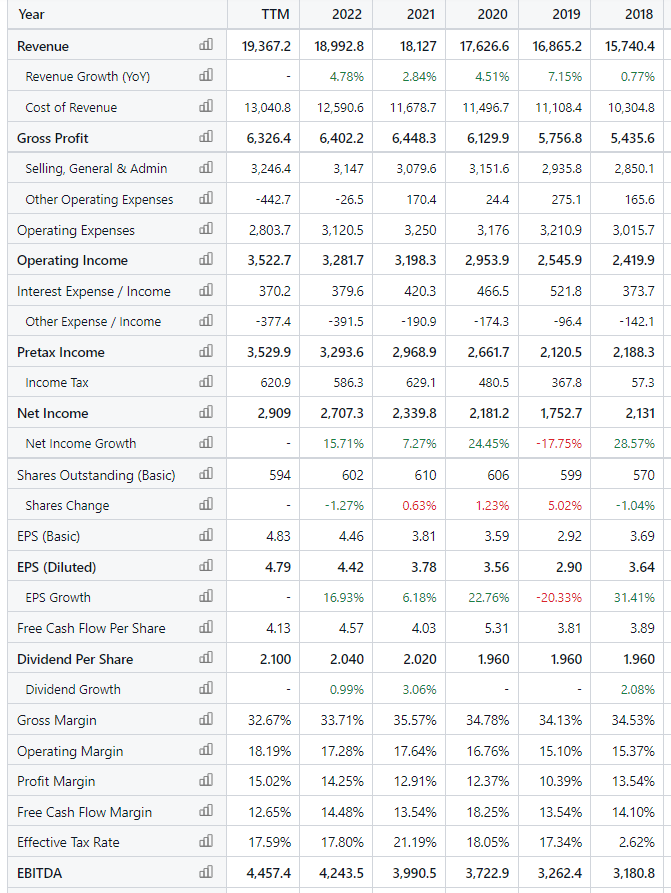
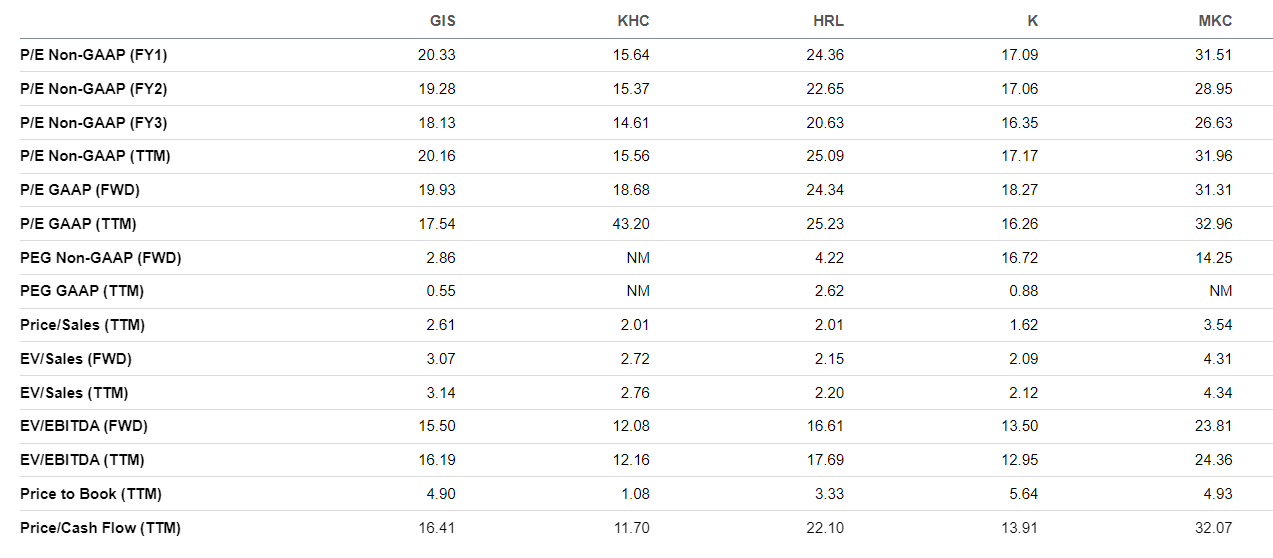
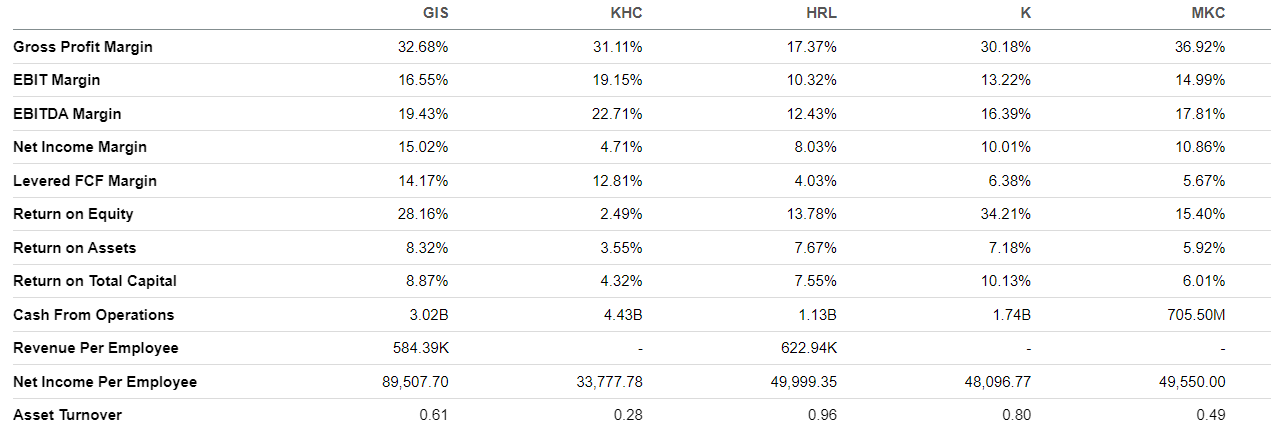
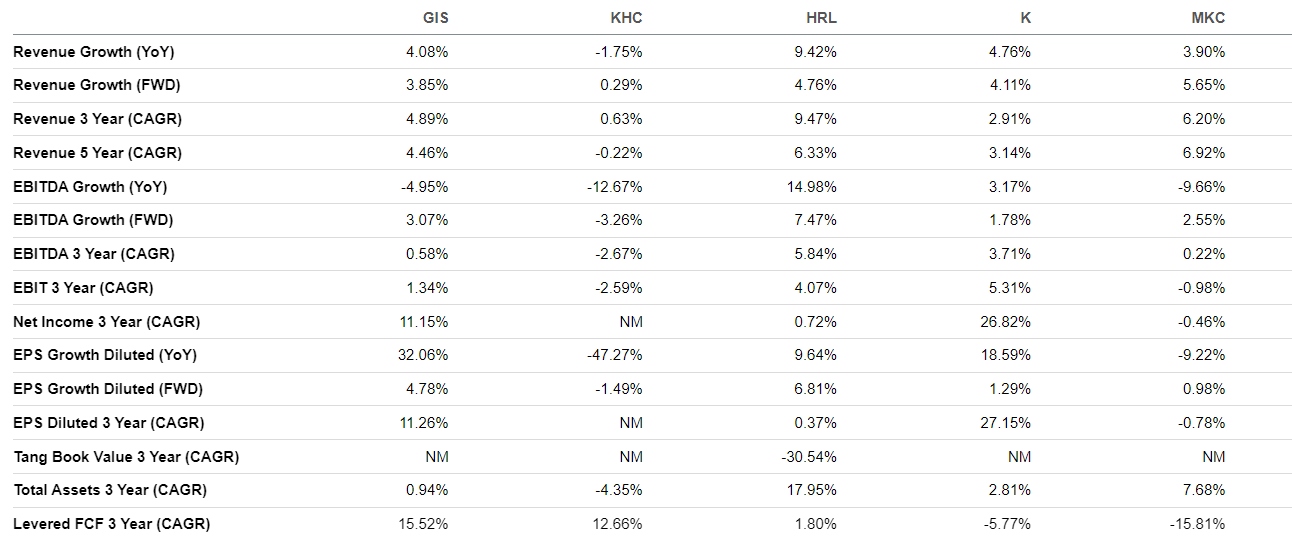
You probably know the 90s hip-hop song “Baby Got Back” by Sir Mix-a-Lot… And if you’re a fan, you’ll be excited to hear he remixed the hit more than 30 years later – all thanks to a new marketing campaign for Chex Mix. The maker of Chex Mix is General Mills (GIS), which delivered a 25% return last year. The consumer defensive name has gotten a lot of buzz lately apart from the hip-hop scene, according to the latest data from Trackstar, our proprietary sentiment indicator. In fact, financial pros have searched it nearly 5x as much as they have Kraft Heinz (KHC) and 12x as much as Kellogg’s (K) over the last month. It has compelling profit margins and generates a ton of cash. Momentum is on its side. But have investors missed the boat, or does GIS have more room to run? General Mills’ Business General Mills makes packaged food across lots of categories: baking, cereal, fruit, ice cream, meals, organic, pasta, pet, pizza, snacks, soups, vegetables, and yogurt. It boasts over 100 brands in its portfolio, including Betty Crocker, Cheerios, Bisquick, Annie’s, Häagen-Dazs, Green Giant, Pillsbury, Progresso, Wheaties, Nature Valley, and Yoplait. The company divides sales into the following segments: North America Retail, Pet, North America Foodservice, and International. Source: General Mills General Mills’ North America Retail segment increased net sales by 11% in Q2 2023 (what GIS calls the quarter that ended in September 2022), driven by favorable net price realization and mix, which included sales boosts in snacks, meals, baking solutions, and breakfast foods. Pet segment net sales were essentially flat from year-ago levels at $593 million. Despite dealing with higher input costs, net sales for the North America Foodservice segment rose 24% during Q2 2023. The company’s International segment was down 27% in Q2 2023 due to yogurt and dough divestitures and a Häagen-Dazs ice cream recall. Financials Source: Stock Analysis GIS has been consistently growing revenues since 2018. While it’s not a growth stock by any stretch of the imagination, the company continues to boost its dividends, going from $1.78 annually in 2016 to $2.10 in 2023. The firm is focused on creating a competitive advantage by building brands, innovating, scaling, and standing for good. The strategy seems to be paying off, as the company’s earnings per share have risen from $2.92 in 2019 to $4.83 over the last 12 months. GIS believes it can continue to grow and profit through strategic acquisitions and divestitures. At first glance, its current ratio of 0.58x may seem concerning. But the company has generally had a low current ratio. For example, the ratio was 0.56x in 2018. The consistency of cash flow from operations and low volatility in revenues insulate GIS’ balance sheet, leaving the company free to hold less cash. Moreover, GIS’ debt-to-equity ratio of 1.16x is good. The ratio has been below 1.5x since 2021. Valuation Source: Seeking Alpha GIS trades at a P/E GAAP ratio of 17.5x, slightly higher than its five-year average of 16.0x. But it’s relatively cheaper than its peers KHC at 43.2x, Hormel Foods (HRL) at 25.2x, and McCormick & Company (MKC) at 33.0x, though K is even cheaper at 16.3x. However, Kellogg’s is set to split into three companies, and investors aren’t sure that will unlock much value. GIS’ price-to-cash-flow ratio of 16.4x is the middle of the pack, lower than HRL at 22.1x and MKC at 32.1x, but higher than KHC at 11.7x and K at 13.9x. Profitability Source: Seeking Alpha GIS’ 15.0% net income margin stands out. It’s notably higher than KHC at 4.7%, HRL at 8.0%, K at 10.0%, and MKC at 10.9%. We love GIS’ stellar EBIT margin of 16.6%. Only KHC claims a better performance at 19.2%. Meanwhile, HRL is at 10.3%, K is at 13.2%, and MKC is at 15.0%. One of the main reasons investors gravitate toward consumer defensive stocks is their ability to generate cash flow. GIS generates $3.0 billion in cash from its operations, significantly higher than HRL at $1.1 billion, K at $1.7 billion, and MKC at $705.5 million. But the cash cow of the group is KHC, with $4.4 billion in cash from operations. Growth Source: Seeking Alpha Most investors jump into consumer defensive stocks for safety and dividends. It’s a bonus if these stocks can showcase growth. GIS grew revenues 4.1% over the last 12 months, compared to KHC at -1.8%, HRL at 9.4%, K at 4.8%, and MKC at 3.9%. GIS’ diluted EPS growth over the last 12 months has been exceptional at 32.1%. Meanwhile, KHC had diluted EPS growth of -47.3%, HRL 9.6%, K 18.6%, and MKC -9.2%. Our Opinion 7/10 GIS returned 25.6% to investors over the last year and 181.8% over the last 10. Despite inflationary pressures, the company’s management has shown it can navigate and thrive in the current environment. But we think the stock has gotten ahead of itself, and to expect the same returns as GIS had in 2022 would be asking for too much. At writing, GIS trades at $77.46 a share. We’d buy if it can get back down to the $60-to-$70 range but wouldn’t chase it into the $80s. |
|
News & Insights |
Just Spilled |
|
Want to get content like this directly to your inbox? Then we urge you to sign up for our newsletter here |