|
Proprietary Data Insights Financial Pros Emerging Markets ETF Searches in the Last Month
|
|||||||||||||||||||||
|
ETFs |
Now’s Your Chance at Another Reopening Trade |
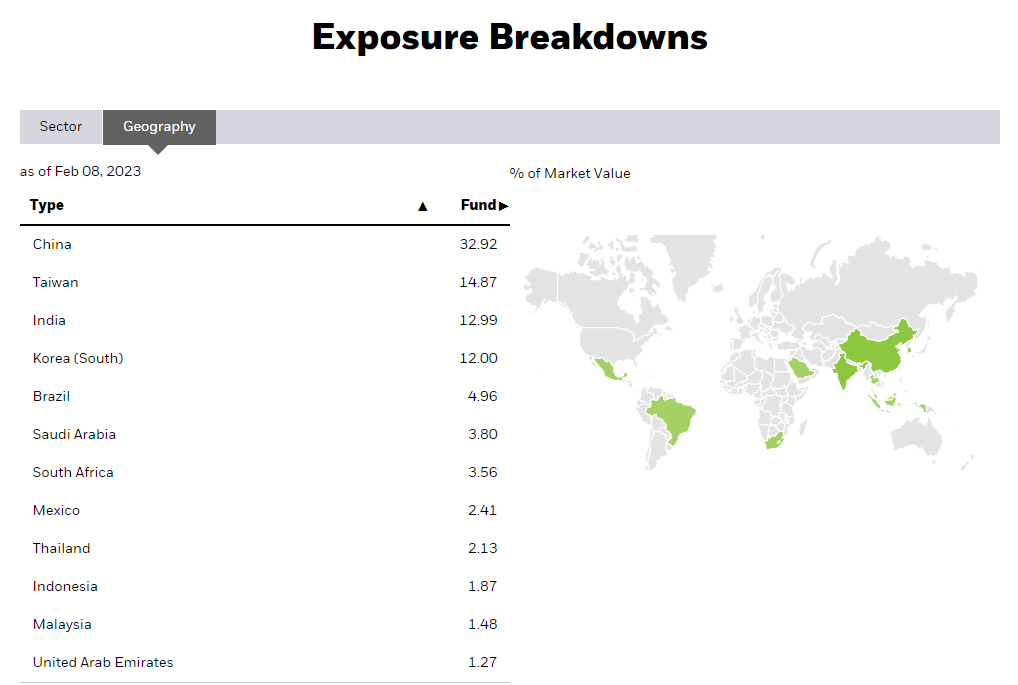
One of the biggest trading opportunities of 2021 was the reopening trade. Once it was clear the FDA would approve a vaccine for COVID-19, traders and investors piled into the restaurant, travel, and retail sectors, as the lockdown hit them hardest. Now, there’s another opportunity to participate in a reopening trade: China is opening up after its prolonged lockdown. And investors are looking for ways to benefit. According to the latest data from our Trackstar database, there’s been a recent surge in some stocks with China-heavy exposure, including Las Vegas Sands (LVS) and Wynn Resorts (WYNN). There’s also great interest in emerging markets ETFs, specifically the iShares MSCI Emerging Markets ETF (EEM). It’s financial pros’ most searched emerging markets ETF over the last month. But as the name implies, EEM doesn’t focus solely on China. It’s a broader emerging markets ETF. That may be why it garnered more than 5x the searches as the popular iShares China Large-Cap ETF (FXI). EEM exposes investors to China while diversifying risk among other emerging markets, including Taiwan, India, and Brazil. Source: iShares While it’s been a rough year for emerging markets with global monetary policy tightening, things might be looking up for this international ETF. iShares MSCI Emerging Markets ETF The iShares MSCI Emerging Markets ETF attempts to track the investment results of an index of large- and mid-cap emerging markets equities. It gives investors convenient access to over 1,200 emerging markets stocks. Key Facts About EEM
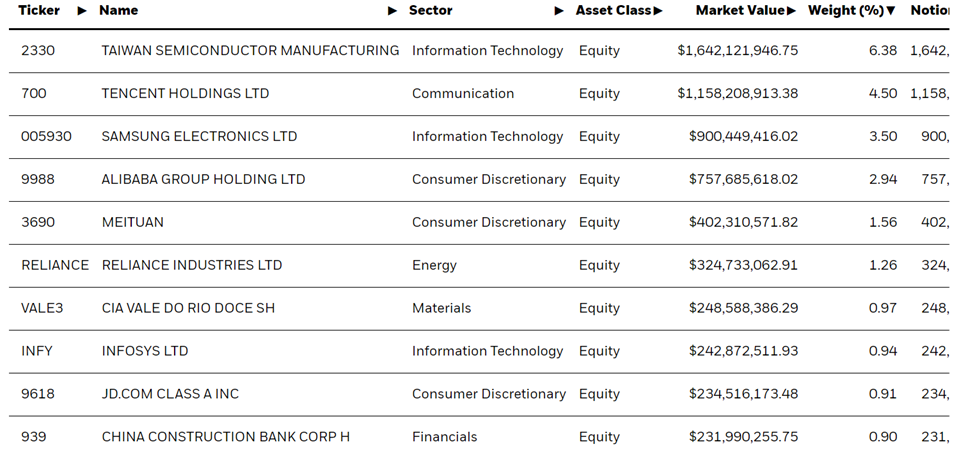
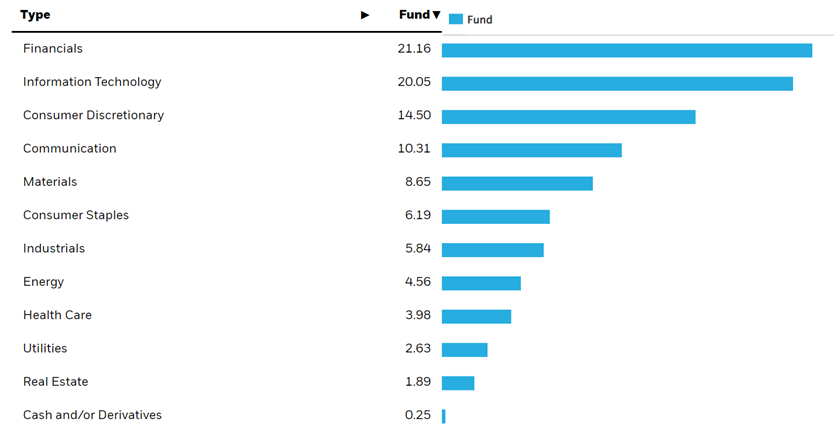
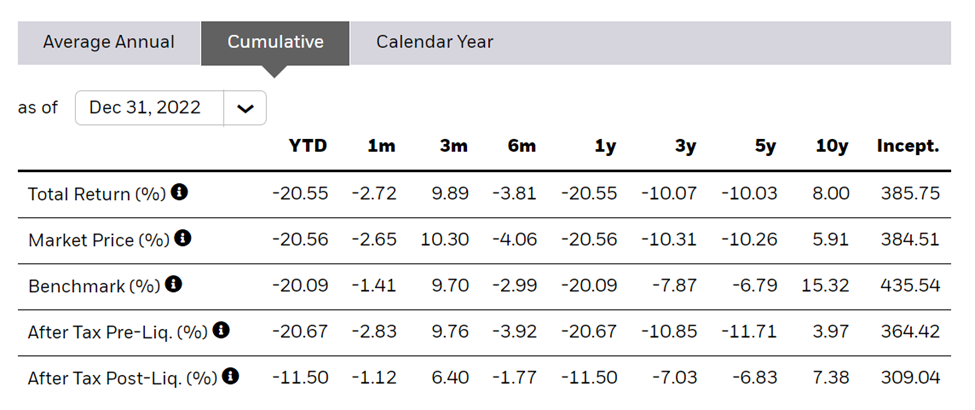
EEM’s top 10 holdings make up approximately 24.1% of its weight. Source: iShares Taiwan Semiconductor Manufacturing (TSM) is the fund’s largest holding, weighing 6.38%, followed by Tencent Holdings (TCEHY) at 4.50%. Despite having over 1,200 positions, EEM is concentrated in the financial and IT sectors, which comprise 41.2% of its portfolio. Source: iShares Performance EEM began trading on April 7, 2003. As of December 31, it’s delivered a cumulative return of 385.8% since its inception. But the returns have been poor over the last five years, with a cumulative return of -10.0% as of the end of 2022. Source: iShares Trading & Investing in EEM EEM is one of the most actively traded ETFs on the market, with a daily average stock volume of 42.5 million shares. In addition, it offers options trading. Competition Investors seeking access to emerging markets via ETFs have several options. Some of the more notable ones include the SPDR Portfolio Emerging Markets ETF (SPEM), Schwab Emerging Markets Equity ETF (SCHE), Vanguard FTSE Emerging Markets ETF (VWO), and iShares Core MSCI Emerging Markets ETF (IEMG). Portfolio Composition
VWO has 4,702 positions in its portfolio, notably larger than EEM at 1,229, SPEM at 3,102, SCHE at 1,838, and IEMG at 2,857. EEM has the most concentrated portfolio, with its top 10 assets comprising 24.1%, followed by SCHE at 22.5%, IEMG at 20.9%, VWO at 18.9%, and SPEM at 17.9%. Fees
EEM charges an expense ratio of 0.69%, which is exceptionally high compared to its peers, although relatively low among ETFs in general. VWO is the cheapest ETF out of the group, with an expense ratio of 0.08%, followed by IEMG at 0.09%, SPEM at 0.11%, and SCHE at 0.11%. Dividend Yield
EEM pays an annual dividend of $0.97 per share, a current yield of 2.4%. If you’re an income investor, VWO is your pick, with a dividend yield of 5.04%. Three-Year Cumulative Performance
The best performer over the last three years has been VWO at 3.6%. EEM has been the worst performer at -2.50%. Many of these ETFs include stocks from China. Of course, the region has been dealing with lockdowns for the last three years, negatively impacting the performance of these stocks. Our Opinion 5/10 Emerging markets ETFs have struggled over the last three years due to strict COVID-19 lockdown policies. But with China reopening and monetary tightening slowing, Wall Street believes emerging markets stocks will begin to rebound, and we do too. While we like EEM, VWO is a much better pick in our opinion due to its lower expenses and higher dividend. |
|
News & Insights |
Just Spilled |
|
Want to get content like this directly to your inbox? Then we urge you to sign up for our newsletter here |