From the Census Bureau: Permits, Starts and Completions
Housing Starts:
Privately-owned housing starts in June were at a seasonally adjusted annual rate of 1,215,000. This is 8.3 percent above the revised May estimate of 1,122,000 and is 2.1 percent above the June 2016 rate of 1,190,000. Single-family housing starts in June were at a rate of 849,000; this is 6.3 percent above the revised May figure of 799,000. The June rate for units in buildings with five units or more was 359,000.Building Permits:
Privately-owned housing units authorized by building permits in June were at a seasonally adjusted annual rate of 1,254,000. This is 7.4 percent above the revised May rate of 1,168,000 and is 5.1 percent above the June 2016 rate of 1,193,000. Single-family authorizations in June were at a rate of 811,000; this is 4.1 percent above the revised May figure of 779,000. Authorizations of units in buildings with five units or more were at a rate of 409,000 in June.
emphasis added
 Click on graph for larger image.
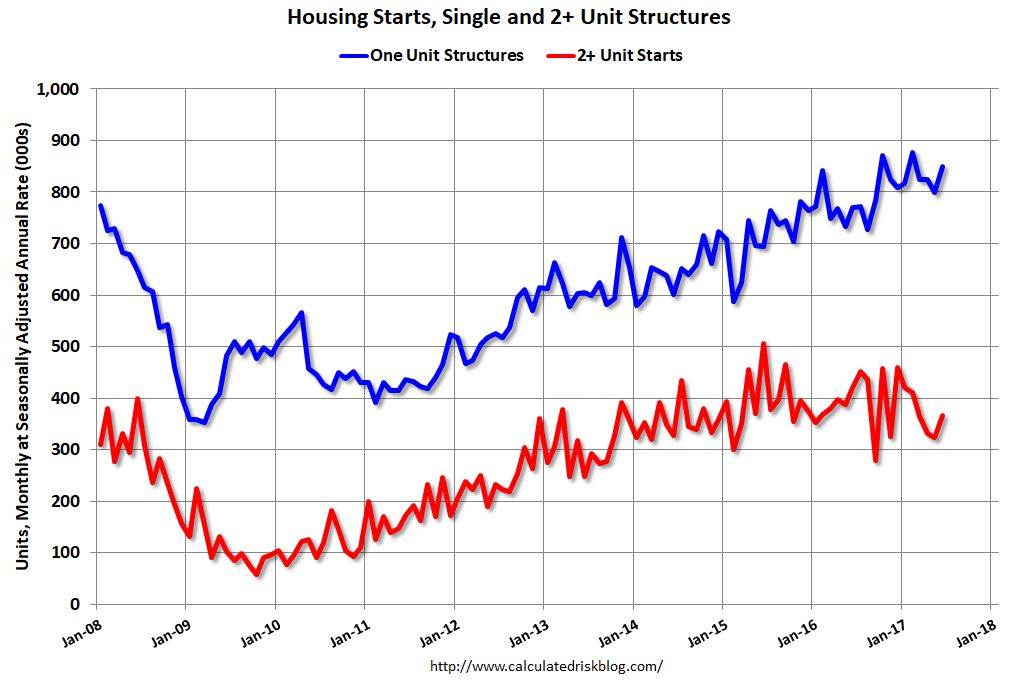
The first graph shows single and multi-family housing starts for the last several years.
Multi-family starts (red, 2+ units) increased in June compared to May. Multi-family starts are down 13% year-over-year.
Multi-family is volatile month-to-month, but has been mostly moving sideways over the last couple of years.
Single-family starts (blue) increased in May, and are up 10.3% year-over-year.
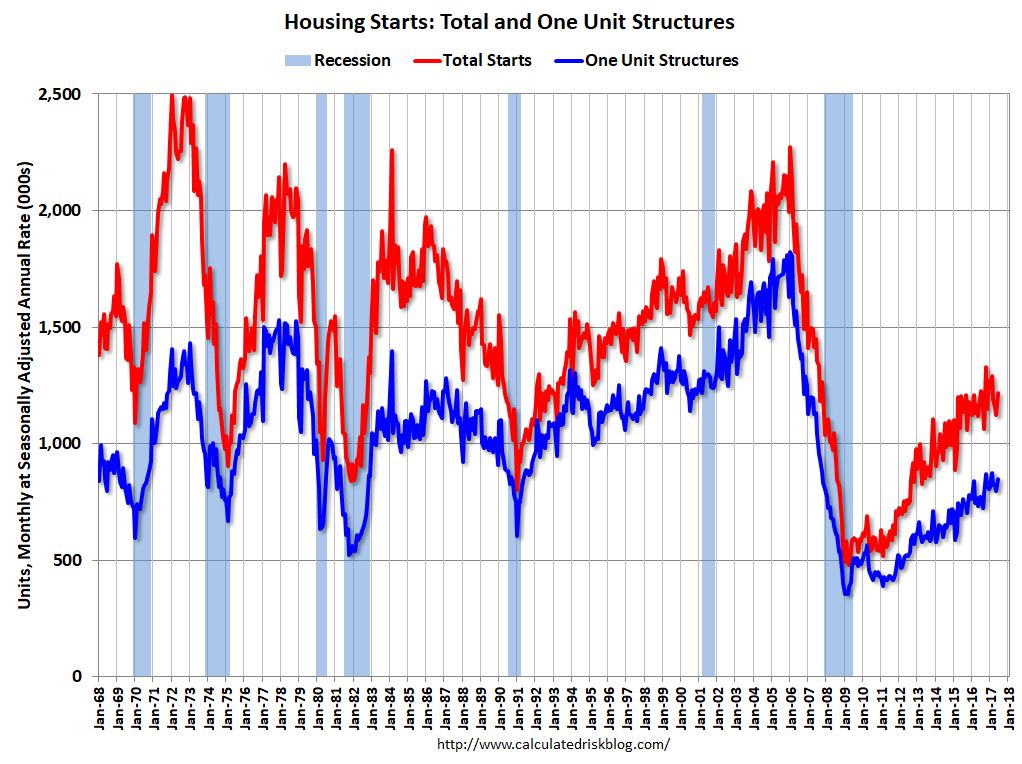 The second graph shows total and single unit starts since 1968.
The second graph shows the huge collapse following the housing bubble, and then – after moving sideways for a couple of years – housing is now recovering (but still historically low),
Total housing starts in June were above expectations, and starts for May were revised up. This was a solid report. I’ll have more later …