Technical analysis suggests lower prices, but seasonality points towards rising stocks. Is it possible to find a worthwhile trade in this conflicting environment? Yes it is. Find out how here.
The S&P is caught between a (seasonal) rock and a (technical) hard place. How so?
Seasonality for the remainder of the year is predominantly bullish, but the recent selloff has caused some technical damage. The technical picture is bearish unless the damage is “repaired” by a move back above resistance.
There’s an obvious conflict between indicators, which makes identifying high probability trades more challenging.
What is a high probability trade? A high probability trade signal (buy or sell) needs to be confirmed by the three pillars of market forecasting:
1) Technicals
2) Sentiment
3) Seasonality
When all three indicators are in alignment, there’s a high probability of a profitable trade/investment. That’s why I call it a high probability trade.
The Profit Radar Report continuously monitors technicals, sentiment, and seasonality to find high probability trades. Prior high probability trades include going short in April 2010 and May 2011 along with buy signals in March 2009, October 2011, and June 2012.
Putting the Odds in Your Favor
Bearish technicals currently disagree with bullish seasonality. Sentiment is more or less neutral. The three pillars don’t align. There is no high probability trade set up right now, but that doesn’t mean there aren’t any good trades.
When indicators don’t align for high probability trades, the Profit Radar Report looks for the next best opportunity: A low-risk trade.
A low-risk trade has a higher reward than risk potential. In fact, the risk is limited by a well-defined support/resistance level used as stop-loss.
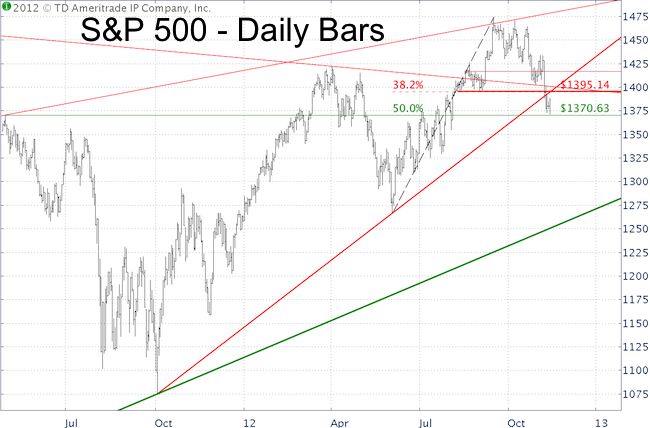
The chart below shows the most recent low-risk trade for the S&P 500 (SPY).
The thick horizontal red line is the 38.2% Fibonacci retracements of the points gained from June – September 2012 at 1,395. This level is reinforced by the ascending red trend line from the October 2011 low and S&P 1,396, which provided support several times in August/September.

In short, S&P 1,396 is a key support/resistance level. The S&P’s drop below 1,396 triggered a sell (as in go short) signal with a stop-loss a few points above. This makes it a low-risk trade.
Next support outlined in Sunday’s Profit Radar Report is at 1,37, which is made up of the 50% Fibonacci retracement and the April 2011 low. The S&P hit this support on the nose this morning and bounced 19 points.
A break below 1,371 will unlock more bearish possibility, with the potential for a steep decline.
Foot in the Door (with Steel Toe Shoes)
Regardless the size of the down move, going short at 1,396 keeps the trading “foot in the door” in case there will be a waterfall decline. All with minimal risk. The stop-loss just above 1,396 protects the “foot” against any bruising.
This is important because there are some bullish possibilities. For right now, the down trend is our friend, but we are fair weather trend friends willing to shift with a move above resistance.
The VIX seasonal pattern shows a clear seasonal opportunity right after Thanksgiving. This may make for a juicy VIX and stock trade if technicals confirm the message of seasonality.
The Profit Radar Report outlines high probability and low-risk opportunities along with the support/resistance levels needed to manage an active trade effectively.