I’ll be throwing up charts all day as I find them, feel free to contribute to the stream if you have any goodies.
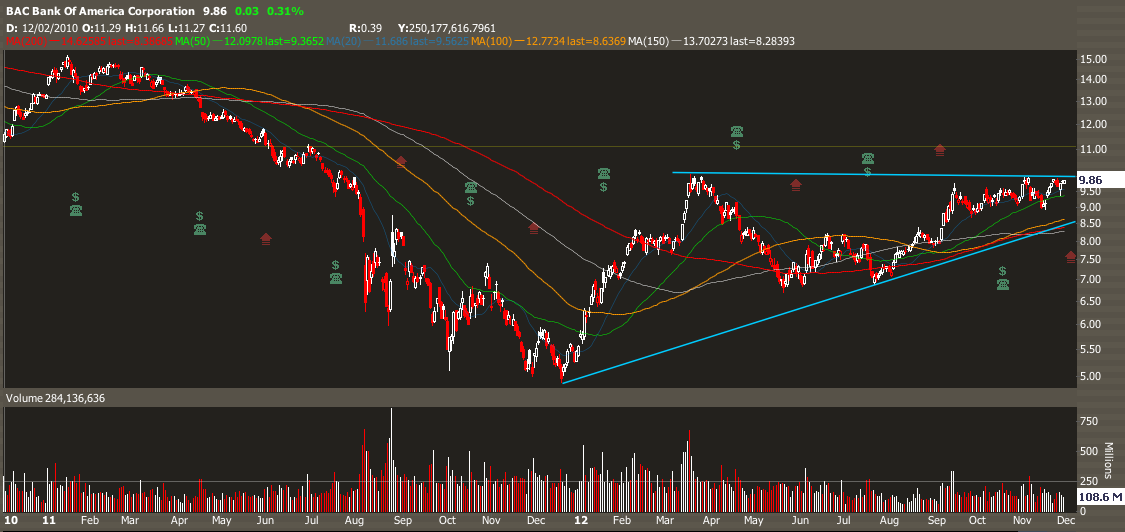
First up, take a look at a 2yr chart of $BAC, watching for a breakout above $10:
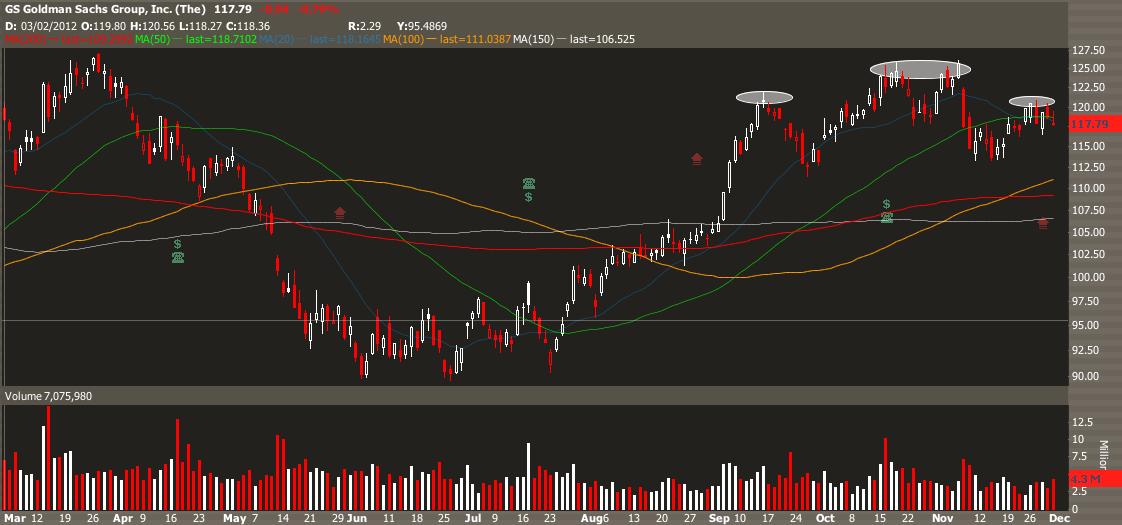
$GS – Price continues to struggle with the 50 day MA, watch for a breakdown with weakness in the financials:
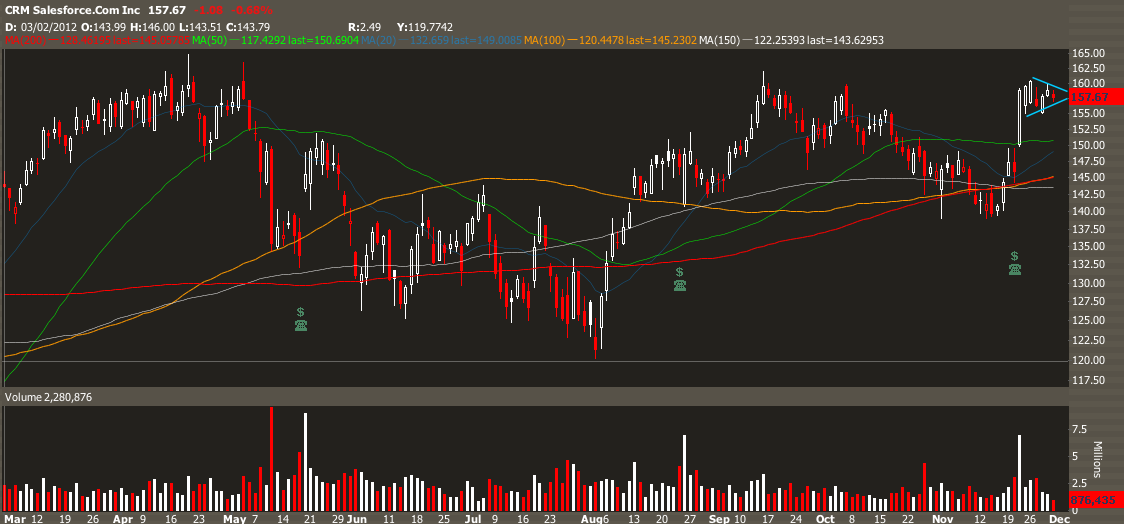
$CRM – Beautiful flag setting up here, watch for a breakout this week:
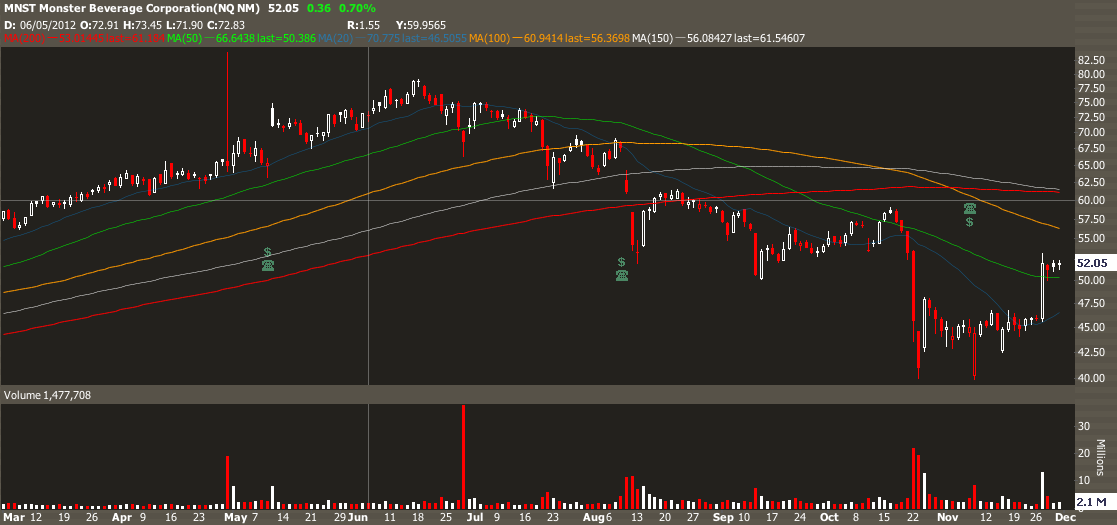
$MNST, another tight consolidation flag pattern that has my attention, watch for another spike higher:
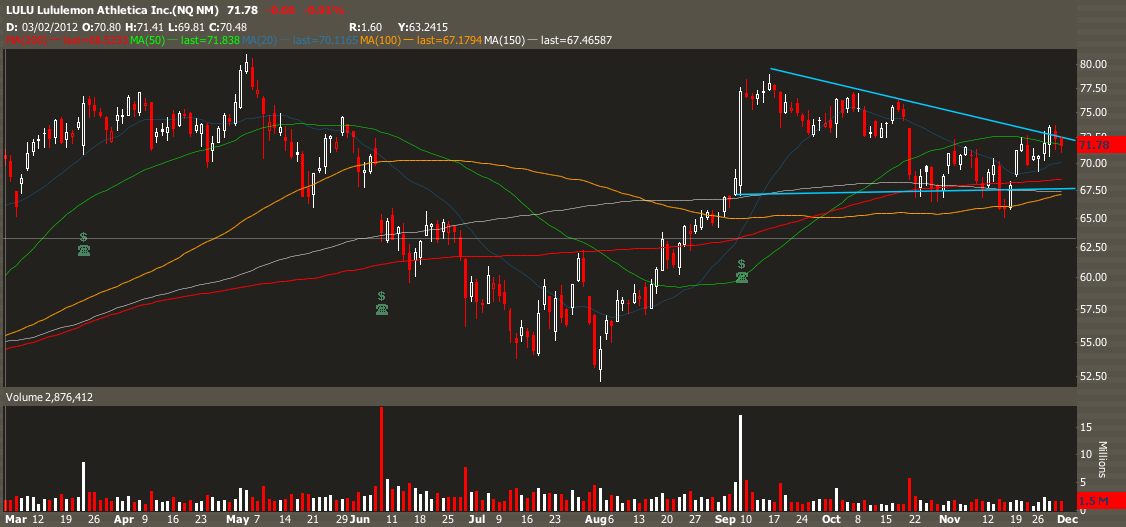
$LULU – Seems to be at an action point here on the 50 day MA. On strength look for a breakout:
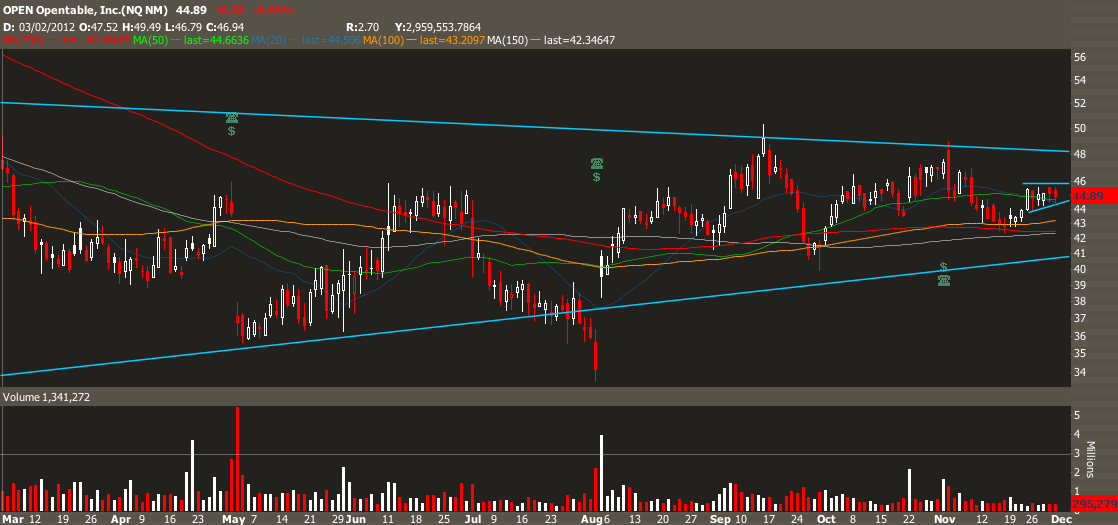
$OPEN – Still watching open here as it sits on the 50 day moving average: