Buying climaxes are at the highest level since April 2010. The April 2010 highs were closely followed by the May ‘Flash Crash.’ Are the current conditions similar to 2010 and should we be concerned about a ‘Flash Crash-like’ event?
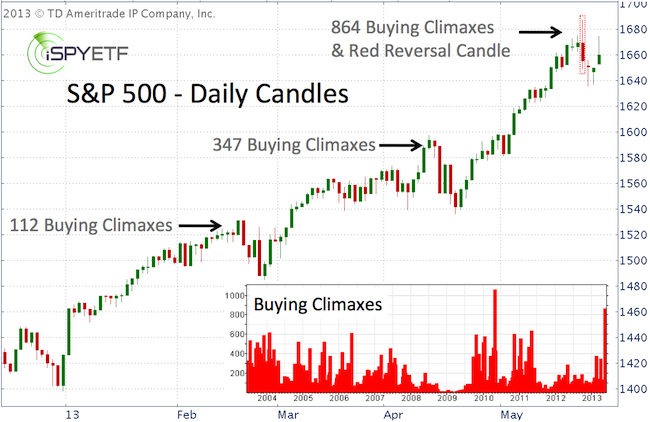
There were 864 stock buying climaxes last week. What is a buying climax and why is that significant?
Buying climaxes happen when a stock (or index) makes a 12-month high, but closes the week with a loss. They are a sign of distribution and indicate that stocks are moving from strong hands to weak ones.
iSPYETF previously pointed out elevated buying climaxes in articles published on February 13 (112 buying climaxes) and April 10 (347 buying climaxes).
Both instances were followed almost immediately by corrections (see chart). Last week’s number of buying climaxes – 864 – eclipses the 112 and 347 climaxes seen prior to the February and April corrections.
In fact, the current reading is the second highest total since 2004 and is surpassed only by the 1,079 buying climaxes in the week of April 30, 2010 (see chart insert).
It sounds dramatic, but it’s worth pointing out that the April 2010 price high was chased by the May ‘Flash Crash.’
Does that mean another ‘Flash Crash’ event is around the corner?
The ‘Flash Crash’ was preceded by historic sentiment extremes and an incredibly concerning equity put/call ratio. In an April 16, 2010 note to subscribers (now known as Profit Radar Report) I warned that:
“The equity put/call ratio is 45% below its six-month average. The message conveyed by the composite bullishness is unmistakably bearish. Once prices do fall and investors do get afraid of incurring losses, the only option is to sell. Selling results in more selling. This negative feedback loop usually results in rapidly falling prices.”
Current conditions aren’t as extreme as they were in April 2010, but they should be of concern to investors, nonetheless.
It doesn’t take a ‘Flash Crash’ to hurt a portfolio. A slow and determined correction can do the same thing ‘Chinese drip torture-style,’ – slower, more painful, but with similar results.
Like in 2010, it will take a ‘watershed’ event, a decline that spooks enough investors, to get the ball rolling.
A break below important support will likely be just such an event. The Profit Radar Report already pinpointed the must hold support level that – once broken – will lead to lower prices.