Temperamental, volatile, bi-polar, doesn’t know what it wants and unpredictable are all fitting descriptions for the month of October on Wall Street. Many major turning points happened in October. Will October 2013 lead to a breakout or breakdown?
Seasonally speaking, October is the most bi-polar month of the year.
October hosted the legendary market crashes of 1929, 1987 and 2008. But October has also killed many bear markets.
October 2011 was such a bear market killer. After falling 20% from the 2011 peak to trough, stocks arrived at a true high probability buy signal in October.
Forgive me for this braggagraph (bragging in the paragraph), but my October 2, 2011 buy recommendation was probably one of my best calls (along with the March 2009 and June 2012 buy signal). Here’s the exact description of the buy signal issued on October 2:
“The ideal market bottom would see the S&P 500 dip below 1,088 intraday followed by a strong recovery and a close above 1,088, but technically any new low below 1,102 could mark the end of this bear market leg.”
A quick intraday dip to 1,074 on October 4 knocked out the 2011 bear and the bear has been unconscious ever since.
What About October 2013?
The QE bull market is two years older now than it was in 2011. In fact, at 55-months of age, the QE bull has already lasted 16 months longer than the average bull.
Nevertheless, October is unlikely to enter the history books as a bear market killer.
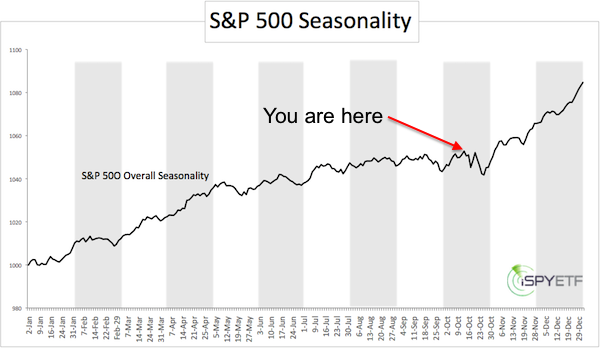
The unique S&P 500 seasonality chart below shows that stocks tend to do quite well towards the end of the year.

The S&P 500 seasonality chart is created from averaging together 62 years of S&P 500 behavior.
Since the S&P 500 (NYSEArca: SPY) is at a different price level every year, using an average of the S&P’s actual values would inappropriately skew the result by overweighting the years when it was at a higher level and vice versa.
To equally weigh every year, the price history is adjusted (using a divisor) to begin at the same level on the first trading day of every year. Then each day’s values for the rest of the year reflect the percentage change from that first day of the year.
(Seasonality charts for the S&P 500 during post election years and during post election years with democratic Presidents are available to subscribers of the Profit Radar Report).
Based on generic S&P seasonality, there may be some more weakness in the later part of October followed by smooth sailing ahead.
Dow Jones, Nasdaq (Nasdaq: QQQ) and Russell 2000 (NYSEArca: IWM) seasonality show a similar pattern.
Seasonality Safety Net
I always look at a composite indicator (made up of multiple indicators from these ‘families:’ seasonality & cycles, sentiment & money flow, technical analysis) and never trust any one single indicator.
Technical analysis provides the most helpful and unique perspective right now. Last week the S&P 500 whipsawed over a major trend line. While confusing for most, this is actually the best signal we could have hoped for.
A detailed analysis of this odd but effective technical signal is available here:
Has the Year-end Rally Already Started?
Simon Maierhofer is the publisher of the Profit Radar Report.
Follow Simon on Twitter @ iSPYETF or sign up for the FREE Newsletter.