In May the Profit Radar Report highlighted a long-term price target for the Nasdaq-100 made up of two Fibonacci levels. This week the Nasdaq reached this target. Is this bullish or bearish?
As a market forecaster, I’m obsessed with finding the next resistance cluster that will serve as target for the next rally.
This resistance cluster for the Nasdaq-100 (Nasdaq: QQQ) was fairly easy to spot as it was made up of two long-term Fibonacci levels.
The May 19, Profit Radar Report said this about the double Fibonacci target:
“Real serious overhead resistance doesn’t come into play until 3,266 – 3,280. That’s 8% away and it should take at least one noteable correction and several more months to get there.”
Several months (and a few minor corrections) later the Nasdaq 100 has arrived and slightly exceeded 3,280.
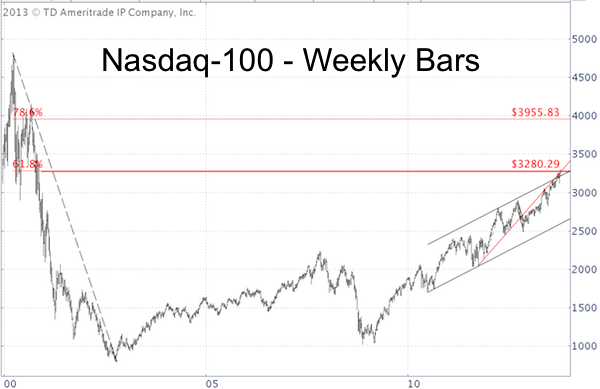
The Nasdaq-100 chart below shows the 61.8% Fibonacci retracement of the points lost from 2000 to 2002 (at 3,280.29) and a Fibonacci projection level originating from the 2002 low is at 3,266.
Now What?
Quite frankly, I thought that the odds of a major market top once the Nasdaq reaches 3,280 were greater than 50%. But I may have to reconsider this expectation or at least put it on hold for now.
A close above such key resistance is generally bullish. Unfortunately, I have a hard time finding another resistance cluster for the Nasdaq. The 78.6% Fibonacci retracement is still 20% away and premature.
De-Isolating the Nasdaq
The Nasdaq doesn’t trade in a vacuum and it often helps to see what other indexes are doing.
The S&P 500 (SNP: ^GSPC), which sports a well-defined trend channel right now, is considerably closer to its trend channel resistance than the Nasdaq-100 to its 78.6% Fibonacci resistance.
The Dow Jones (DJI: ^DJI) is almost trading in its own world right now. A big earnings disappointment by IBM – the biggest Dow component – sent the Dow marginally lower on Thursday while the S&P 500 (NYSEArca: SPY) and Nasdaq closed higher.
Summary
For now the Nasdaq is above support (prior resistance) and the trend is up. In fact, the Federal Reserve and Washington politicians have created a ‘chaos environment’ that could keep prices buoyant for significantly longer.
However, not everything is hunky-dory. The S&P 500 is about to hit resistance that may reject this advance. Two long-term cycles, which predicted the 2000 and 2007 tops, project another market top in 2013/2014. Click here for more details on the S&P 500 cycles.
My take on the market along with a forecast based on technical analysis, sentiment and seasonality is available via the Profit Radar Report.
Simon Maierhofer is the publisher of the Profit Radar Report.
Follow Simon on Twitter @ iSPYETF or sign up for the FREE Newsletter.