Investors find mental safety in group behavior or group think. It’s always easier to buy when everyone else is buying. If everyone’s doing it, it must be right. More often than not, group think is the biggest investment trap. Professional managers as a group now are fully embracing this rally. Good news?
Financial pros tend to have a bad rep. Often for good reason. When financial advisors or money managers as a group start endorsing a stock market rally, it’s often time to bail.
How are the pros – professional investment managers – feeling now? In two words: long and confident.
According to the National Association of Active Investment Managers (NAAIM), the average manager is currently (as of last Thursday) 94.6% invested in stocks.
Contrarians will view this as bearish.
However, the actual data puts the current sentiment extreme into perspective.
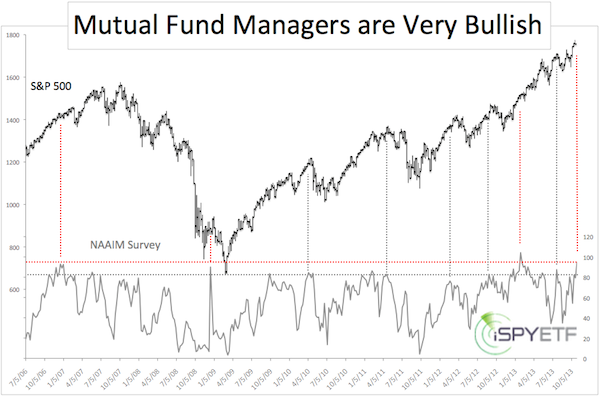
The chart below plots the S&P 500 against the stock exposure of professional investment managers polled by NAAIM.

The current stock exposure is the second highest in the survey’s seven-year history.
Somewhat surprising though, previous extremes (dashed red lines) did not lead to immediate declines. In fact, the S&P 500 (NYSEArca: SPY) continued rallying for weeks in 2007 and 2013.
As a standalone contrarian indicator, the NAAIM survey is about as helpful as the VIX has been in 2013.
That doesn’t mean the survey is worthless, because lesser extremes (gray dashed lines) preceded (and correctly foreshadowed) the 2010, 2011, and 2012 corrections.
Based on the history of the survey, it appears that absolute extreme NAAIM readings (horizontal red line) could be a reflection of strong momentum (and continued gains), while lesser extremes (horizontal gray line) have a better track record as a contrarian indicator.
The NAAIM survey is only one of dozens of investor sentiment indicators I follow.
I don’t ever base my recommendations on any single indicator. However, the general message of increasing enthusiasm is confirmed by a number of other sentiment polls.
Composite sentiment cautions that the up side may be limited, but a few other indicators suggest an impending correction.
The question is how much further the S&P 500 and Nasdaq (Nasdaq: QQQ) can rally from their overbought condition. The following article takes a closer look at the up side potential:
Can the S&P 500 Rally another 20%?
Simon Maierhofer is the publisher of the Profit Radar Report. The Profit Radar Report uses technical analysis, dozens of investor sentiment gauges, seasonal patterns and a healthy portion of common sense to spot low-risk, high probability trades (see track record below).
Follow Simon on Twitter @ iSPYETF or sign up for the iSPYETF Newsletter to get actionable ETF trade ideas delivered for free.