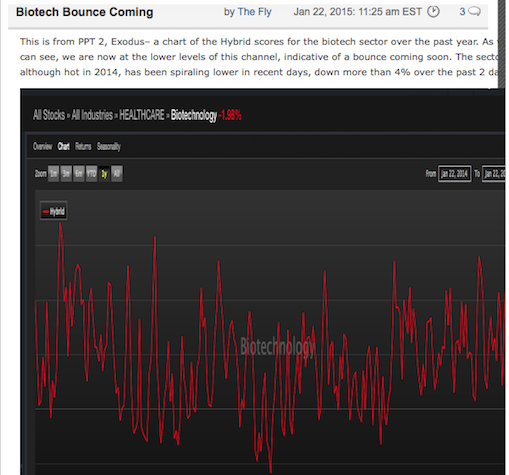
Let me show you a new tool in soon to be released Exodus, the second iteration of The PPT. Our algorithms grade each stock, sector and ETF. We’ve added a lot of visuals to the software, showing stress points and ranges. Last week, inside The PPT, I highlighted how biotech was at the bottom of the range. Now it’s near the top. When I say “range”, I do not refer to stock price, but Hybrid score, which is a combination of technical and fundamental scores, mixed in with lots of sub rosa grading metrics.
Have a look at gold today.
I was going to buy gold yesterday, based on this chart alone. However, I hate gold, deep to the core of my bones, so I was deterred.
As for this sell off: the CAT-MSFT axis of evil cannot be taken seriously. Several of my top positions are up and the dollar is weak, which is good for oil. Gravitate towards commodities today and you should be fine.
