It’s been said that complexity is the enemy of execution. This is true with most things in life, including how you arrange your investments. An optimally performing and easy to manage investment portfolio might be the ultimate goal, but it’s not so simple.
(Audio) What’s your margin of safety? + here’s something that beats the pants off “smart beta”
The larger an investment portfolio becomes the harder it gets to maintain simplicity. That’s because the human inclination is to accumulate clutter under the erroneous assumption that owning more stuff creates a safe environment. And the older we get, the more clutter we accumulate and the less safe we actually become.
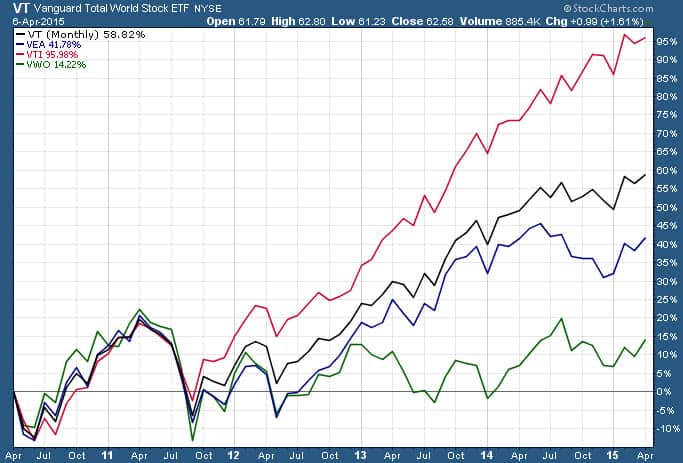
To illustrate this point, I examined the five-year performance of the Vanguard Total World Stock ETF (NYSEARCA:VT) against a portfolio of three ETFs covering the same area. (See chart below)
Portfolio A owns just ticker symbol VT, whereas Portfolio B owns an evenly weighted 33% basket of the Vanguard Total U.S. Stock Market ETF (NYSEARCA:VTI), Vanguard FTSE Emerging Markets ETF (NYSEARCA:VWO), and the Vanguard FTSE Developed Market ETF (NYSEARCA:VEA). Which portfolio performed better? Was it the simple one-ticker total world equity approach or the subtly more complex three-ticker approach of VTI plus VEA plus VWO?
Here’s what I found: VT has gained +58.82% over the past five-years whereas an evenly weighted blend of 33% VTI, VEA, and VWO gained +50.66%. In other words, simplicity won, at least during this particular five-year period. Since VT was launched in June 2008, longer-term performance results aren’t unavailable.
In case you’re wondering, VT does cover the same areas as VTI, VEA, and VWO. The underlying index VT tracks is called the FTSE Global All Cap Index and it includes approximately 7,500 stocks of companies located in 47 countries, including both developed and emerging markets.
The largest equity markets covered in VT’s index are the United States, Japan, the United Kingdom, and Canada (which made up approximately 51%, 8%, 7%, and 4%, respectively, of the Index’s market capitalization as of Q4 2014). VT typically holds around 6,600 of the stocks that make up its target index (covering nearly 99% of the Index’s total market capitalization) and a representative sample of the remaining stocks.
One of the problems with rigorous portfolio construction is that to be rigorous you have to simplify so much that it becomes easy to dismiss. However, erring on the side of simplicity can produce enviable results for anyone with enough stamina and guts to try it.
Follow us on Twitter @ ETFguide
