In the previous post I sketched out the basic correlation between M and P, when M is changing really fast. Here we’ll take a deeper look, and begin to explain why the correlation between M and P is not perfect. Let’s start with an identity:
P = M/(M/P)
That’s a sort of stupid identity, because if you simplify you get P = P. But it turns out to be pretty useful. If you take rates of change you get:
inflation = (money supply growth rate) – (percent change in real money demand)
(Technically, all these equations should actually be expressed as first difference in logs.) Where did I get the terms ‘supply’ and ‘demand’? It turns out that the central bank controls the nominal supply of base money, and the public controls how much real cash balances they want to hold. So you can model inflation by modeling those two variables.
Now let’s return to the table in the previous post. Notice that over 40 year periods the growth rates of M and P almost never differ by more than 10% (Libya’s the only exception.) So one way of thinking about the correlations we see is to assume that there is some factor or factors causing the real demand for money to change, but their impact is rather modest, and doesn’t get bigger when the money growth rate gets really high. So if real money demand is always changing by single digit annual rates over 40 year periods, then long run inflation will closely correlate with long run money supply growth, when the latter variable is growing really fast. That’s why the QTM tends to do best in the high inflation cases, money demand changes pale by comparison.
Next let’s see if we can go a bit further, and explain the various discrepancies between money supply growth and inflation. We know that in an accounting sense it’s explained by changes in real money demand, i.e. real cash balances, but why would the public choose to hold more or less real cash balances? What explains shifts in the real demand for money?
After Libya, two of the larger gaps are in East Asia, South Korea and Singapore. In both cases money growth was much higher than inflation. In an accounting sense that meant that the public in South Korea and Singapore were holding larger and larger cash balances. Not just in nominal terms (as in Argentina) but even in real terms. Their total holding of purchasing power rose by 9.3% per year in South Korea and 7.2% per year in Singapore, for many decades. (The Singapore data is only for 1963-89.) Why is that, why hold more purchasing power? The answer is obvious—these economies grew very rapidly in real terms, and hence the real demand for money rose over time. As the public became much richer and did much more shopping, they chose to hold larger real cash balances.
The sum of inflation and real GDP growth is NGDP growth. If people hold larger real cash balances when real GDP grows, then perhaps the best way to think about the QTM is not to look at the correlation between money growth and inflation, but rather between money growth and NGDP growth. In both Singapore and South Korea the money growth rate is much more closely correlated with NGDP growth than inflation. But if we insist on modeling inflation, then here’s what we have so far:
inflation = (Ms growth) – (real money demand growth)
Ms growth = f(Fed policy)
M/P growth = f(real GDP growth, other stuff)
Let’s try this conjecture. When real GDP grows by X%, people choose to carry X% more real balances, to use for shopping, etc. In that case, you’d expect the inflation rate to be equal to:
Inflation = Ms growth rate – real GDP growth rate + error term due to effects of other stuff
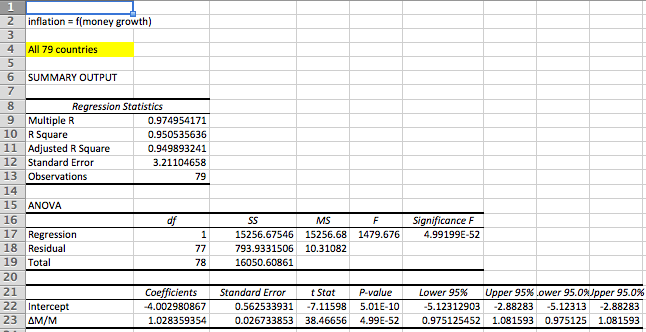
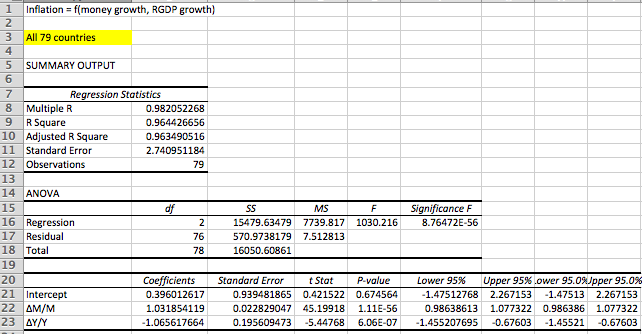
And that’s (almost) exactly what we found in the regression in the previous post. Here I’ll first show a regression w/o real GDP growth, and then repeat the regression from the last post, with RGDP growth:
The coefficient on money growth is roughly one in both cases, and the coefficient on real GDP growth is roughly negative one in the second. Growth is deflationary. And the adjusted R2, which was already 95% in the simple regression of M and P, improves to over 96% when real GDP is added.
There is (or should be) nothing surprising about the finding that growth is deflationary, it’s the prediction of this very simple money demand model. It’s also the prediction of the AS/AD model—as the LRAS curve shifts to the right, the price level declines. The only thing surprising is that so many people find this surprising.
By the way, suppose we label the “other stuff” with the letter V. Then we have:
delta P = delta M – delta Y + delta V.
Look familiar? It’s really just an identity; we need to explain the other stuff (V) to turn the Equation of Exchange into a model.
Let’s look for more hints in the data set. Of the 79 cases, it seems like the vast majority show a money growth rate that is larger than the inflation rate. That’s really not surprising, as almost every single country averaged positive RGDP growth over that period (except Guyana), and we’ve seen that positive economic growth holds down inflation, as the public desires to hold larger real cash balances.
Indeed the only surprise is that there were 12 cases where prices grew faster than the money supply, despite positive RGDP growth. There were 12 cases where the inflationary impact of the “other stuff” was more than the deflationary impact of the real GDP growth. We’ll model the other stuff in the next post, but first let’s briefly return to the issue of real GDP growth. Here are two questions:
1. Can we assume that growth in M has no causal effect on Y in the long run?
2. And if so, why are M and P positively correlated in the short run?
In the data set it looks like rapid money growth does not cause faster real GDP growth, at least in the long run. The 10 highest inflation countries averaged 4.0% real GDP growth, and the 10 lowest inflation countries averaged 4.5% RGDP growth in the long run. Money seems roughly long run superneutral, or perhaps hyperinflation is actually slightly negative for growth (as Mr. Ray Lopez has hypothesized.)
Then what’s going on in the short run? Why does everyone think recessions reduce inflation and booms raise inflation? Here’s a hypothesis. Suppose NGDP growth varies over time, due to monetary policy shocks. And let’s assume that while money is long run superneutral, in the short run it has real effects–perhaps due to sticky wages and prices. Thus in the short run, an increase in NGDP growth leads to both faster real GDP growth, and higher inflation. In that case it would look like growth is inflationary, even though growth would actually be deflationary. Thus if NGDP growth rose by 4%, and both RGDP growth and inflation rose by 2%, it would look like growth was inflationary. But in fact the NGDP growth (i.e. monetary policy) was causing 4% higher inflation, ceteris paribus, and the extra 2% RGDP growth was holding down the inflation rate, limiting the increase in inflation to 2%.
If this is the way the world works then one might expect many cognitive illusions to form. People would think growth was inflationary, whereas in fact it would be deflationary, as the regression in the previous post showed, and as our theoretical model predicts. Procyclical inflation would reflect bad monetary policy (unstable NGDP growth) and inflation would be strongly countercyclical under a sound monetary policy regime (stable NGDP growth.) If the central bank predicts that inflation will pick up during a boom period, they are predicting their own incompetence.
To summarize, it seems like the less restrictive version of the QTM is supported by the evidence. If the money supply is increased by X%, this will lead in the long run to both prices and NGDP being X% higher than otherwise. RGDP will be mostly unaffected. But we’d still like to explain more of the discrepancies, the “other stuff.” In the next post I’ll focus on those countries where inflation was higher than money growth, despite a growing real economy. If you prefer to use the Equation of Exchange, then these are the rare cases where V rose by more than Y, over long periods of time. We’ll also explain liquidity traps.
And in the post after that we’ll look at what happens when money supply growth rates are endogenous. How does that affect the QTM? It’s all there in the data set, if we look closely enough. BTW, don’t think that this analysis has no implications for the low inflation world we live in today. Monetary policy always and everywhere affects inflation and NGDP; we just need to figure out how to interpret what’s going on.
PS. Some commenters pointed out that the data really should be first differences of logs. That’s right, and I’m embarrassed to say that I don’t know if it is, or if it’s ordinary percentages (which is what I assumed when I had Patrick Horan calculate the NGDP growth rates.) I’ll try to get an answer in a few days.

