People are always talking about the Chinese house price bubble. And I have to admit that it was also my impression that Chinese house prices had risen dramatically in recent years. I was curious to see just how much and checked The Economist’s handy interactive graph. And I was completely shocked by what I found:
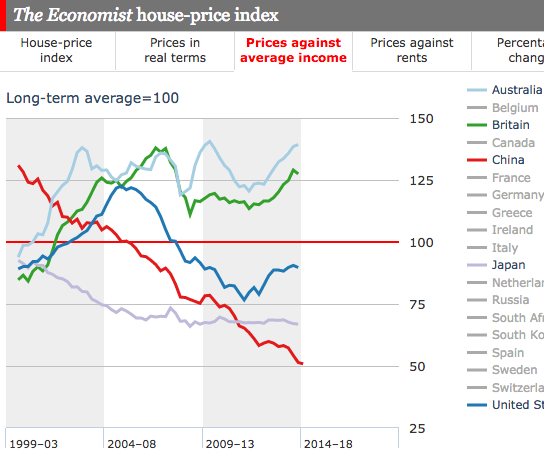
Yes, this is house prices adjusted for changes in income, but still . . . The ratio of Chinese house prices to income has fallen from 130 in 2000 to 50 today?
I showed 4 other countries for comparison purposes, and they all seemed to be about what I’d expect. But China?
Questions:
1. Is the data in The Economist wrong? And if so, where can I get the correct data?
2. If it’s accurate, does this mean China never had the house price bubble that everyone is talking about?
What am I missing here?
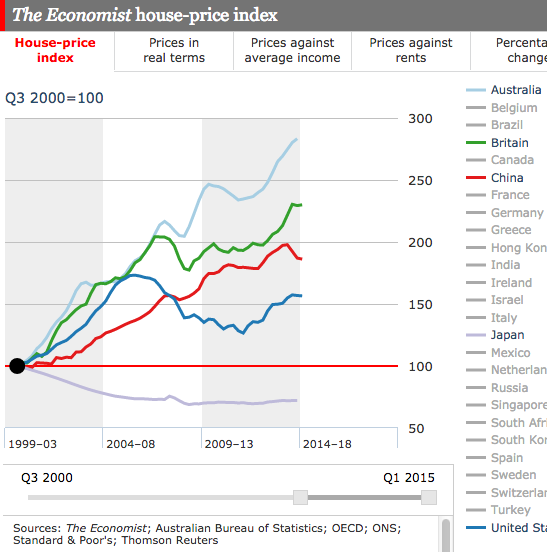
PS. In nominal terms the Chinese prices look more impressive, but considering how much China’s boomed since 2000, I even find the nominal increase to be quite underwhelming—somewhere between the US and the UK. And don’t mention specific cities, I only care about the overall Chinese housing market, not individual cities.
 PS I have a new post at Econlog.