Not Just Long or Short and No Signals
The indexes that power VelocityShares new BSWN, LSVX, and XIVH funds have been live since 2011, but they haven’t been directly accessible via exchange traded products until July 2016. The goals of these new funds are pretty straightforward, on the long side BSWN & LSVX track upside volatility with some fidelity while minimizing decay costs, while XIVH captures the premium typically available by being short volatility, but with a hedging component to reduce drawdowns during corrections and bear markets.
The technology backbone of these VelocityShares funds is quite simple—and counter-intuitive. Each of these Exchange Traded Notes (ETNs) tracks a mix of both long and short VIX futures. You’d think that the short and long positions would just cancel each other out—but they don’t.
The long positions are managed as a 2X leveraged fund (similar to TVIX), and the short positions as a –1X inverse fund (similar to XIV). Both long and short positions use daily end-of-day rebalancing to keep their daily percentage moves consistent with the moves of their underlying index (short term VIX Futures—SPVXSP) and their leverage factors. By selecting the weights of the long and short positions in these funds VelocityShares positioned them at three different points on the volatility spectrum—ranging from volatility spike catcher all the way to hedged inverse volatility.
The baseline allocations / strategies for these three funds are shown below:
| Ticker | 2X long % | -1X short % | Strategy |
| BSWN | 45% | 55% | Tail Risk (strong long bias) |
| LSVX | 33.33% | 66.67% | Long / Short (long bias) |
| XIVH | 10% | 90% | Hedged short volatility (strong short bias) |
The chart below shows the behavior of the two longish funds against the popular VXX and 2X leveraged UVXY / TVIX.
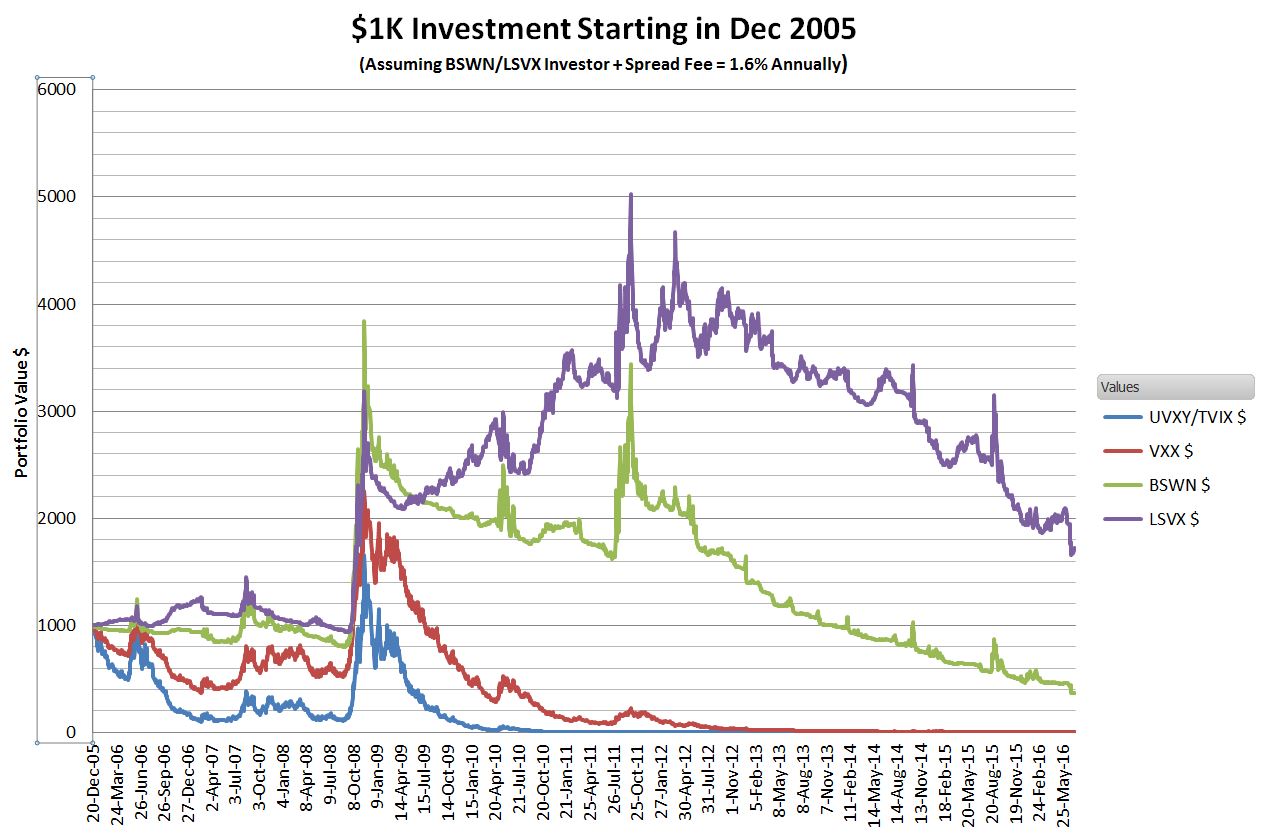
This simulation shows that the BSWN and LSVX portfolios managed to retain an impressive amount of value ($368 & $1724 respectively) over an eleven year period while the VXX and UVXY/TVIX portfolios withered away to nothing ($2.86, $0.00008) respectively).
The next chart shows the simulated behavior of XIVH compared to the popular XIV and SVXY -1X inverse volatility funds.
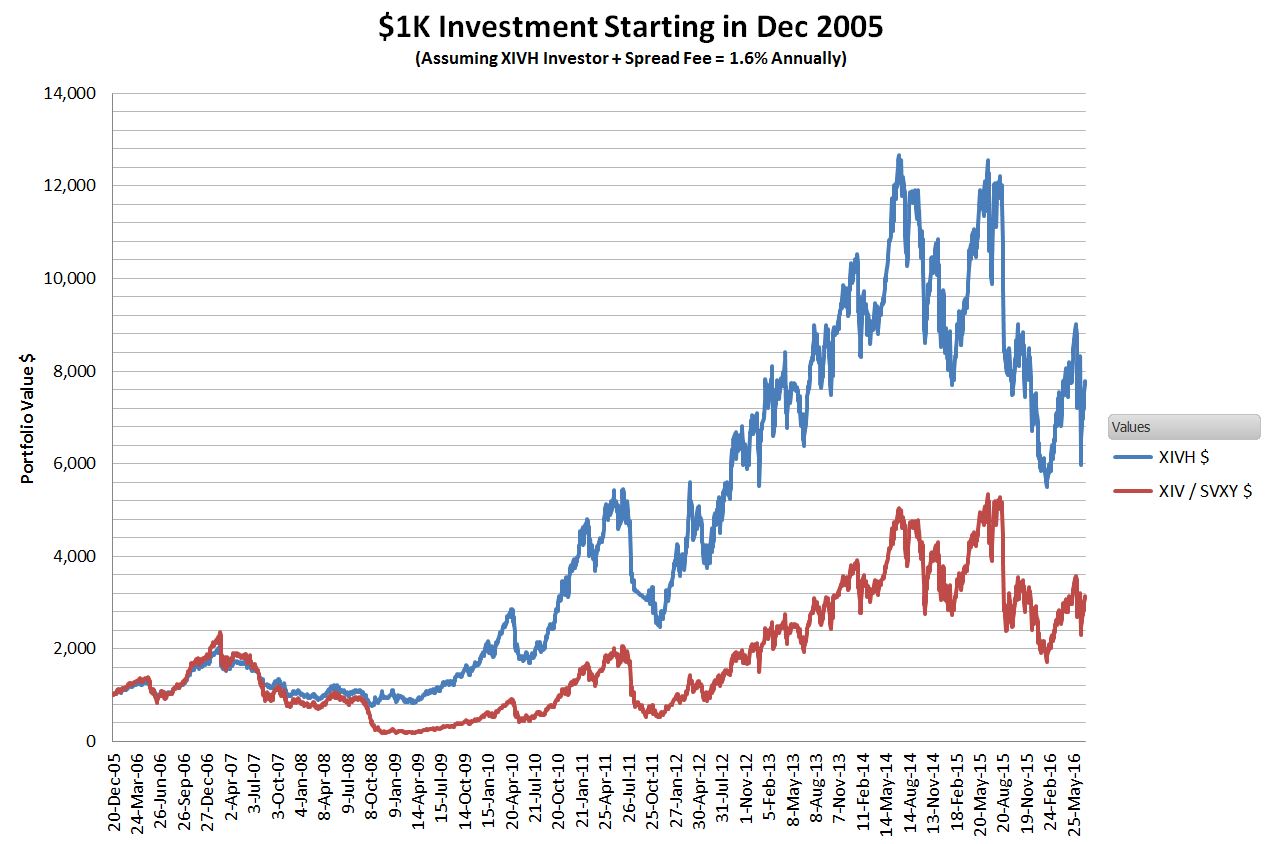
Wow, quite a ride—including a peak value of more than $12K for the XIVH portfolio followed by a drawdown to half of that in less than 2 years.
Over this time span, the 2008/2009 bear market was the key differentiator between these two funds. The 2X long allocation of XIVH’s portfolio beautifully protected it during the financial crisis.
The chart below compares the two funds starting immediately after the 2008/2009 bear market.
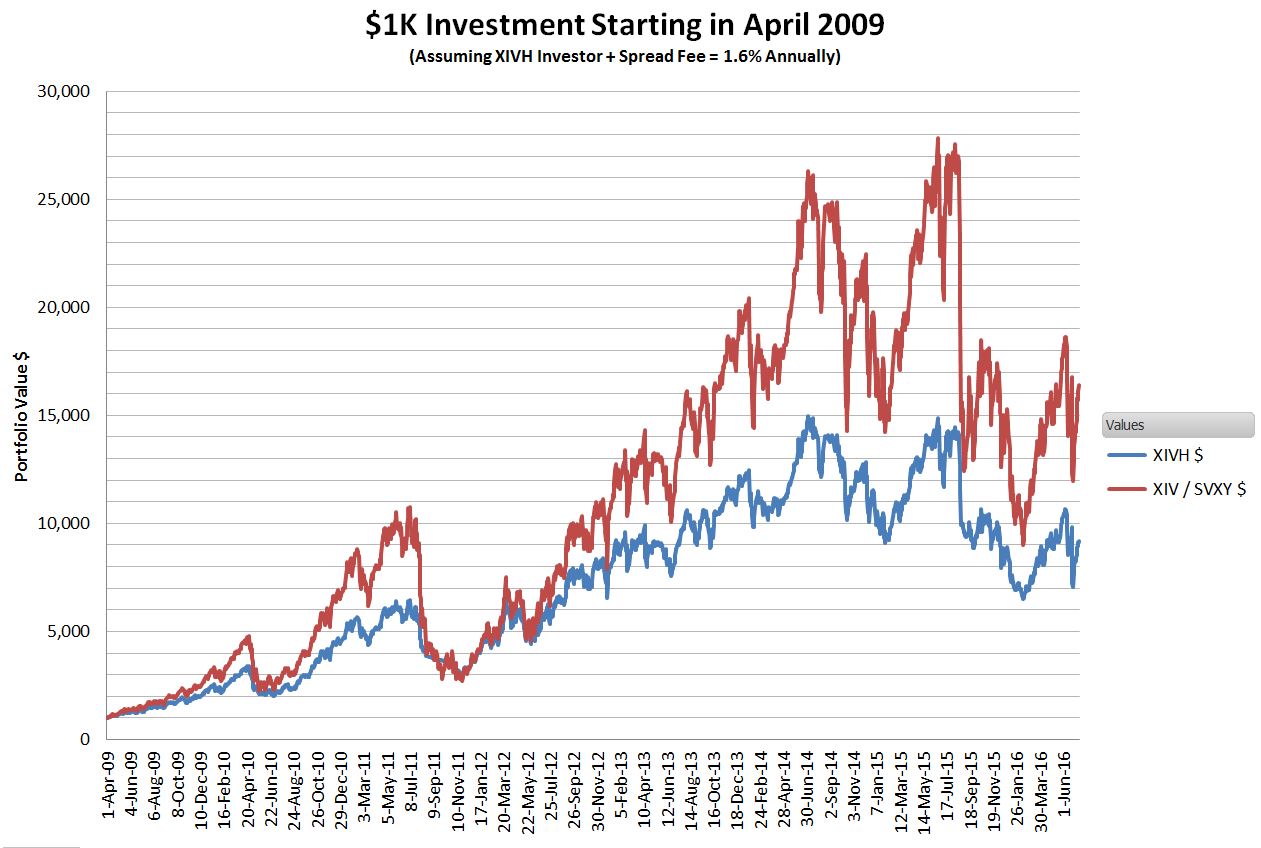
When starting in April 2009 XIV/SVXY has better absolute performance, but XIVH’s volatility and drawdown percentages are better. XIVH’s drawdown percentage during the 2011 correction was half of XIV/SVXY’s.
The Trend is Their Friend
Leveraged funds actually perform better than their leverage factors in trending markets. Consider the example of a hypothetical 2X leveraged fund where the underlying fund goes up 10% a day for three days:
| Day | Underlying % | Underlying | Underlying Cumulative % gain | 2X leveraged
With daily reset |
2X fund
Cumulative % gain |
| Day 0 | 100 | 100 | |||
| Day 1 | +10% | 110 | 10% | 120 | +20% |
| Day 2 | +10% | 121 | 21% | 144 | +44% |
| Day 3 | +10% | 133.1 | 33.1% | 172.8 | +72.8% |
Instead of the 66.2% gain you might have expected from the 2X leveraged fund, it went up 72.8%—a 6% bonus. See this post for a real world example of how the 2X long TVIX overachieved in this fashion.
Leveraged funds can also lose less than you’d expect in markets that are moving against them—if the underlying is strongly trending against them the percentage losses in the leveraged funds will be less than the leverage factor would indicate.
Winner Take All
The other key attribute of these funds is a “winner take all” characteristic. If there is a volatility spike the 2X long portion of the portfolio grows rapidly and the inverse portion shrinks rapidly. Fund allocations (e.g., initially 45% long, 55% short) dynamically shift towards the long side of things during a volatility spike –exactly what you’d like to see happen. Conversely, if volatility is slumping the funds dynamically shift their allocations towards the short side.
Some Reset Required
There are some downsides to using this long / short technology. With an unconstrained “winner take all” strategy the losing side of the portfolio shrinks to the point where there’s nothing to build on when the trend reverses—and the trend will always reverse. To address this issue the funds do periodic resets back to their initial weighting factors. However, this resetting introduces another problem—path dependency. Not only does it matter how much VIX futures move in price, it also matters when the VIX futures move relative to the reset schedule of the funds. For example, if a volatility spike occurs right before a reset it can have a significantly different impact on the fund’s value compared to a spike right after a reset.
The funds take a two-tiered approach to mitigate path dependency. Each of the funds is rebalanced back to its target weighting quarterly and there’s a weekly rebalance of a rotating subset of assets within the funds.
Volatility of Volatility is a Drag
Another downside of these funds is that they don’t do well if the values of the underlying VIX Futures are choppy. If VIX futures are up strongly one day, and down sharply the next these funds will suffer—both their trend compounding and their “winner-take-all” strategies take multiple days of trending action to work well. When volatility of volatility is high it drags down the performance of all leveraged funds—both long and short.
Not Great at Black Swans
Volatility spikes that ramp up quickly (e.g., flash crashes, overnight geopolitical / economic surprises) are not captured particularly well by the longish funds (BSWN, LSVX). If these funds are operating close to their target weights then the short side will significantly drag down the performance of the 2X long side during quick volatility jumps.
The short volatility oriented fund, XIVH would be at some risk of termination if a historically unprecedented volatility spike (e.g., VIX spike of >70%) occurred. These funds terminate if the intraday indicative value drops 80% or more from the previous day’s close. If this situation occurs the holder would likely receive somewhere between 0% and 20% of their previous day’s holdings in cash (no lower than zero). XIVH would be significantly less likely to terminate than standard inverse volatility funds (e.g., XIV/SVXY) because it maintains a 2X long position also.
No Signals Need Apply
Most volatility funds that aren’t just pure long or short plays rely on algorithms to monitor market parameters (e.g., VIX moving averages) and then generate signals that cause allocations to be shifted. I’ve listed some of these funds and the parameters they monitor.
| Tickers | Parameters Monitored |
| VQT, PHDG | S&P 500 volatility, VIX 5 & 20-day moving averages, Fund losses |
| VQTS | S&P 500 volatility, VIX Futures Term Structure |
| XVZ | VIX term structure (VIX/VXV) |
| VIXH | VIX Future absolute prices |
BSWN, LSVX, and XIVH and two other VelocityShares funds (TRSK and SPXH) do not make allocations based on signals, nor do they rely on any characteristics outside the underlying short term futures themselves. They don’t shift allocations based on the term structure between short and medium-term VIX Futures, VIX term structure, VIX volatility or S&P 500 historic volatility.
I think this self-sufficiency is a significant advantage. The volatility landscape is relatively young, with VIX futures only trading since 2004. The interplay between VIX futures of various expirations, the VIX, and equity markets has evolved over time and I don’t see any indication those relationships have stopped shifting. By avoiding linkages to these factors BSWN, LSVX, and XIVH should exhibit more consistent behavior over time compared to the other strategy funds. But to be clear, they do have their dependencies—specifically the trendiness and volatility of the underlying short term VIX futures index.
Complicated Fee Structure
The issuer of these ETNs, the Swiss bank UBS, has levied a complex transaction fee in addition to the annual fee (1.3%). The “Futures Spread Fee” captures some of the costs associated with the daily rebalancing of the funds’ long and short positions. I’m guessing this fee will increase the annual costs associated with owning these funds by around 0.3%.
Low Volume and Low Asset Base
Initially these funds will have low volumes and relatively low asset levels. This naturally leads to concerns about liquidity. In reality, the liquidity of all Exchange Traded Products is critically dependent on the nature of the underlying securities they track. If the underlying index of an ETP is based on small-cap stocks in a 3rd world country then great care is required for all but the smallest trades, however in the case of these VelocityShares ETPs, their underlying is short term VIX futures—which are high volume, very liquid securities. As a result, traders will find that with a little care they can make large purchases or sales without significantly shifting the prices of these funds. For more information and suggestions on trading low volume funds see Evaluating ETP liquidity and Trading Low Volume ETPs.
Hedging Hurdle—How Much Decay?
Funds that are effectively long volatility are attractive candidates for hedging equity portfolios because volatility reliably spikes up when stocks plummet. Unfortunately when the market isn’t panicking long volatility positions often decay quickly. One approach to get around this decay is to apply these hedges only during high-risk times. However, corrections / bear markets are notoriously difficult to predict—if crystal balls were that good there’d be no need for hedging. Since BSWN and LSVX’s decay rates are relatively low holding them all the time becomes a viable option.
The chart below shows historical monthly decay rates.
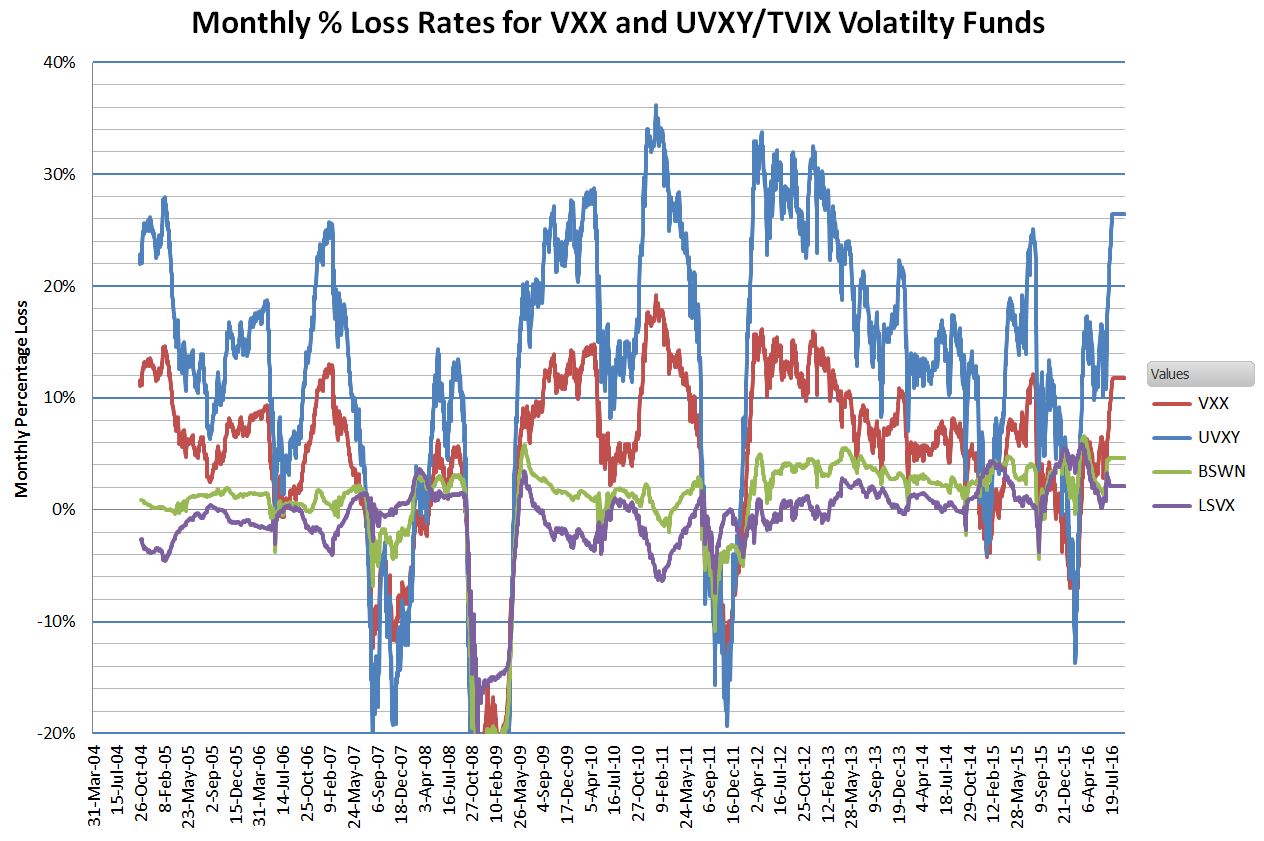
This simulation shows that the decay of VelocityShares’ BSWN and LSVX would have been dramatically lower than TVIX/UVXY and VXX during relatively quiet markets—BSWN decaying mostly in the 1% to 2% per month range and LSVX running in the -1% to +1% range.
How Much Oomph do BSWN and LSVX Have?
While low ongoing losses are very important for any potential hedge strategy it’s also important to know how much these funds will likely jump when a volatility event occurs. This jump data helps establish the required “hedge ratio”—the percentage of a portfolio’s assets that should be held in a long volatility fund to compensate for the losses in the rest of the portfolio during a market correction / crash.
The chart below shows the peak percentage increases in VIX, UVXY, VXX, BSWN, and LSVX during some historical volatility spikes—some of which lasted months, others a day or two.
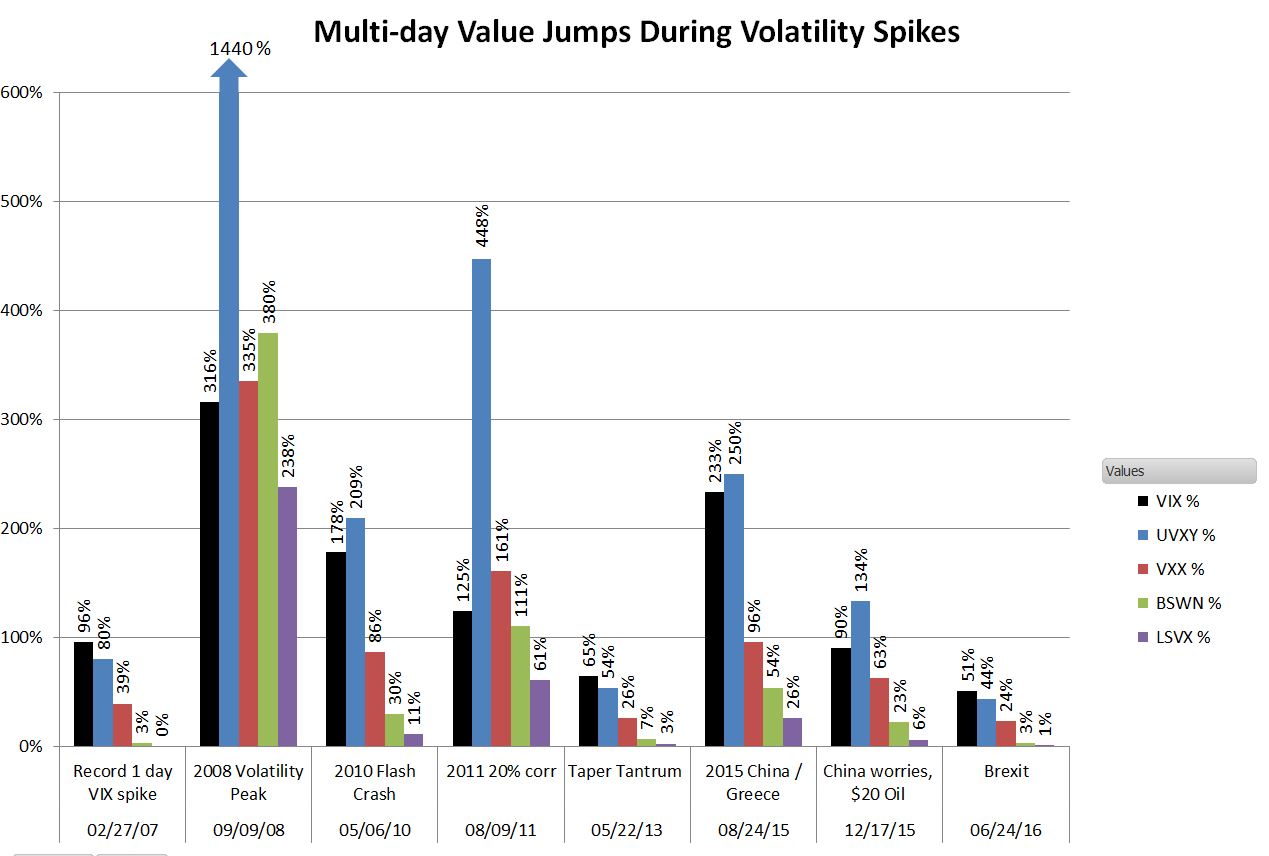
Not surprisingly, in the jump category UVXY is the top performer for investible securities, with VXX coming in second most of the time. BSWN and LSVX perform very well during longer, more severe events—not a bad characteristic to have.
Traversing the Volatility Landscape
Volatility investing has been a minefield for investors. If you’re long volatility you expose yourself to devastating decay losses if your timing isn’t perfect. Alternately if you’re short volatility you risk being blown up by vicious volatility spikes.
VelocityShares’ long/short strategy funds allow us to mitigate risk on both sides of the spectrum using a technology that doesn’t rely on backtested volatility signals or VIX future term structure assumptions. The indexes the BSWN, LSVX, and XIVH funds are based on have been published since 2011 and have performed appropriately through a wide range of market conditions. I expect them to continue doing their jobs well.
Resources
- VelocityShares websites: BSWN, LSVX, XIVH
- Prospectus for BSWN, LSVX, XIVH
- Hedging Equity Volatility with VIX-Based Instruments
- Volatility Strategies Explained: Long & Short VIX Strategies
- S&P 500 VIX Futures Long/Short Strategy Methodology