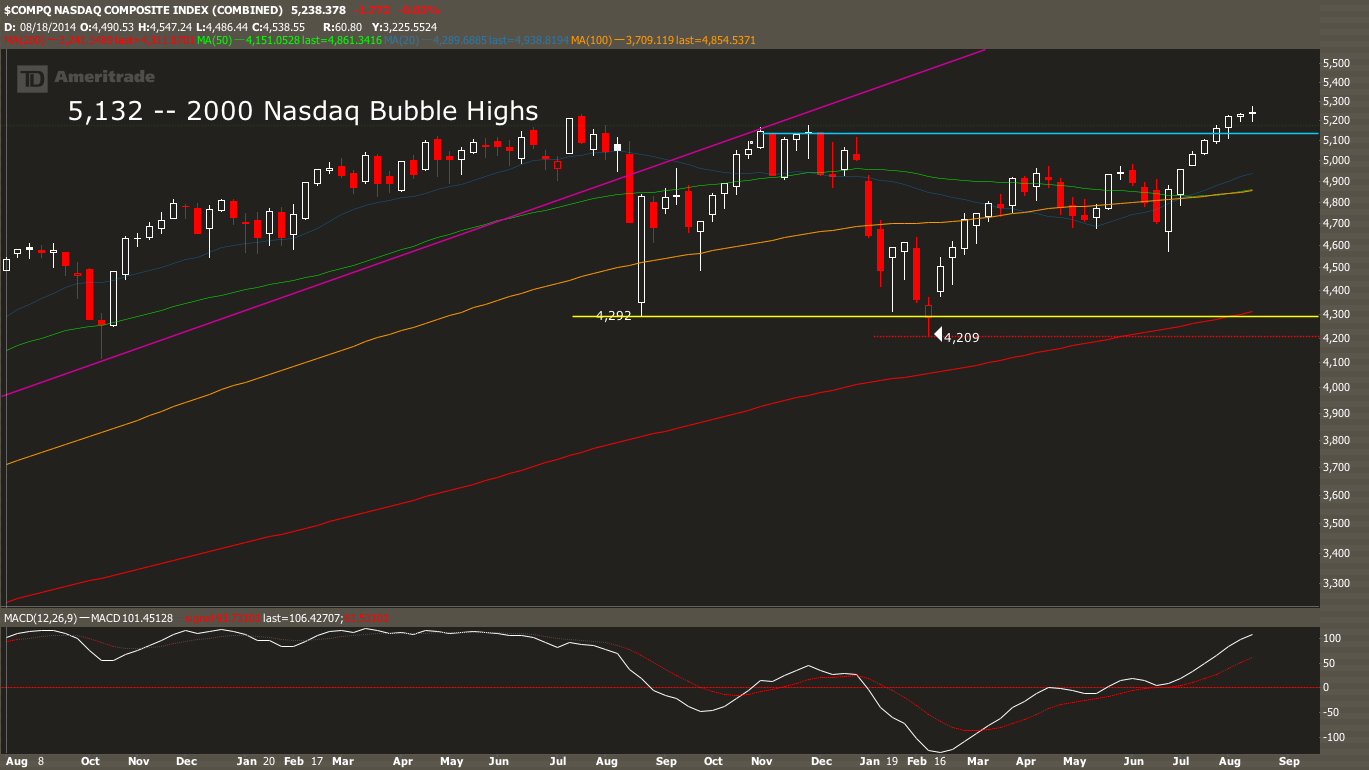
Here is a weekly view of the Nasdaq Composite index, which created what looks like a “spinning top” candlestick. From Investopedia:
A spinning top is a type of candlestick formation where the real body is small despite a wide range of price movement throughout the trading day. This candle is often regarded as neutral and used to signal indecision about the future direction of the underlying asset.
2 Year Weekly chart $COMPQ:
 __
__
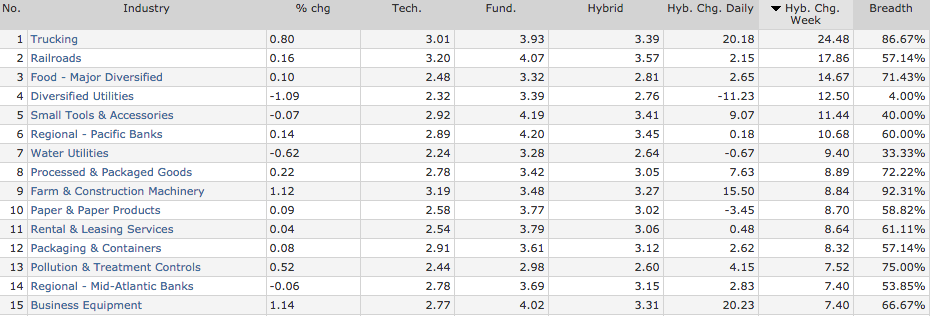
Transportation takes the top spot with trucking & railroads taking the top spot week over week:
 ___
___
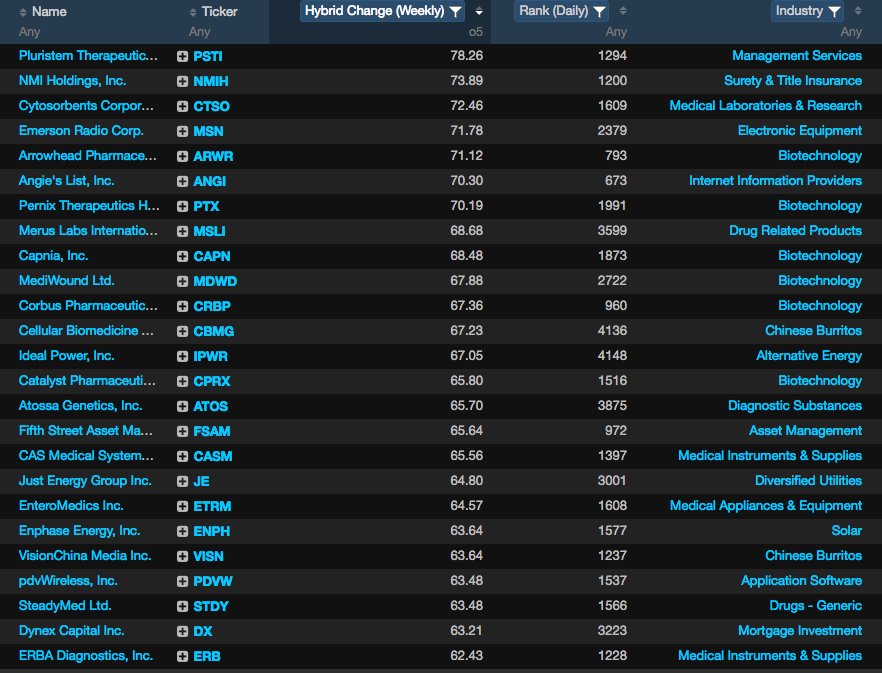
Looking inside Exodus, the following tickers saw the greatest jump in hybrid score this week:
 __
__
For those new to the site and wondering what the hybrid score is, CLICK HERE.
Have a good weekend all.