Inside Exodus, I run a chat room called The Pelican Room. Inside, we look for short term trades and momentum. This week was all about oil, as we had a number of charts trigger on OPEC’s decision to limit production.
Let’s take a look at a few of the trades this week, so you guys can have a better understanding of what goes on behind the scenes.
First off, industry is important. Very Important. If you can find the industry moving, you odds for a profitable trade increase tremendously.
Second, it is all about multiple time frames. You must zoom in and out different timeframes to find the action point in stocks. Once you can figure these two things, trading becomes a little easier.
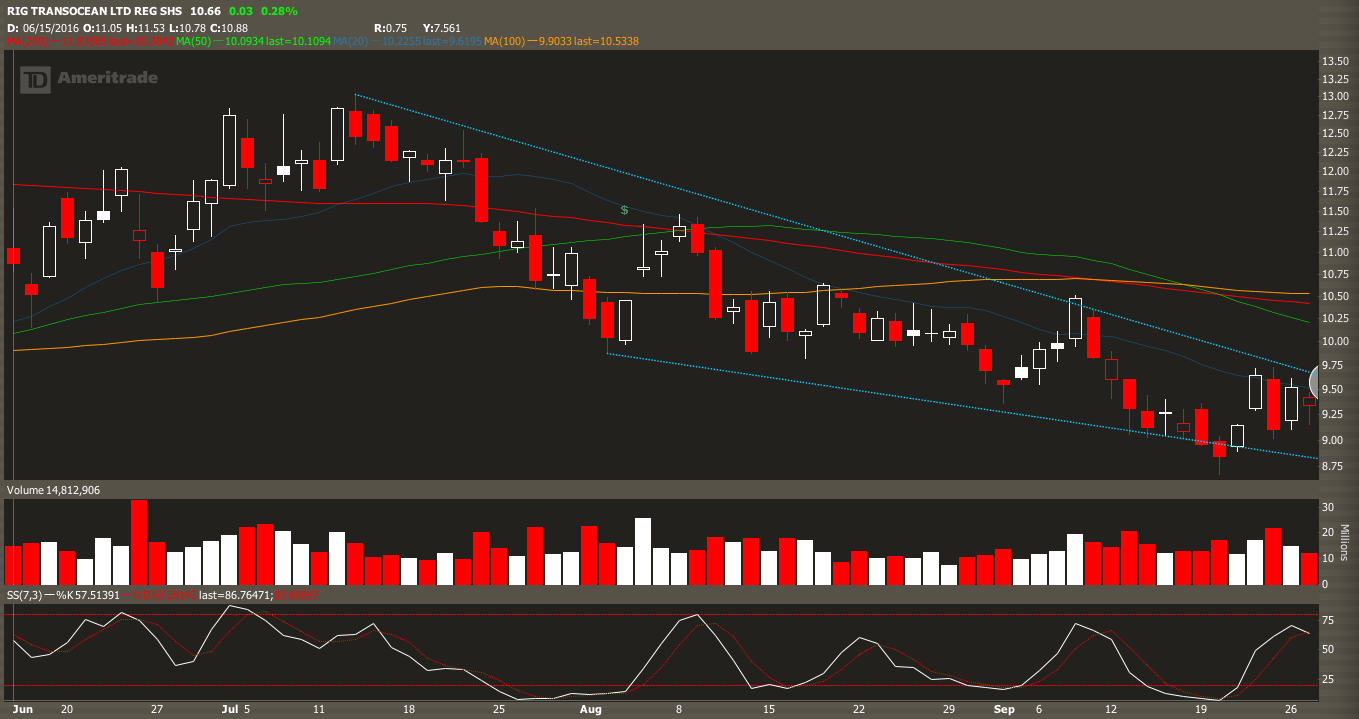
First up is $RIG, with oil moving we were looking for the stock to breakout of this falling wedge pattern. Here’s the daily chart before the break:
 __
__
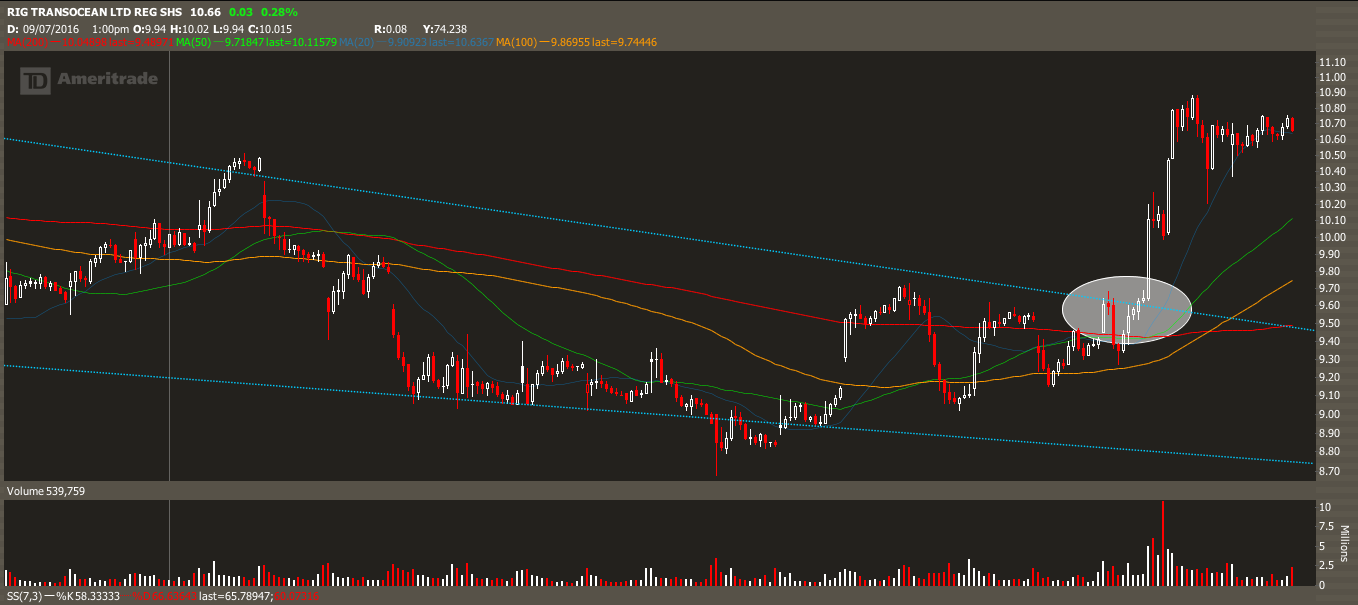
Zooming into the 30 minute chart gives us a clear definitive line in the sand to find our action point. Notice the nice break with volume? that is where we want to enter the trade, and we did. The rest is history as you can see below:
 __
__
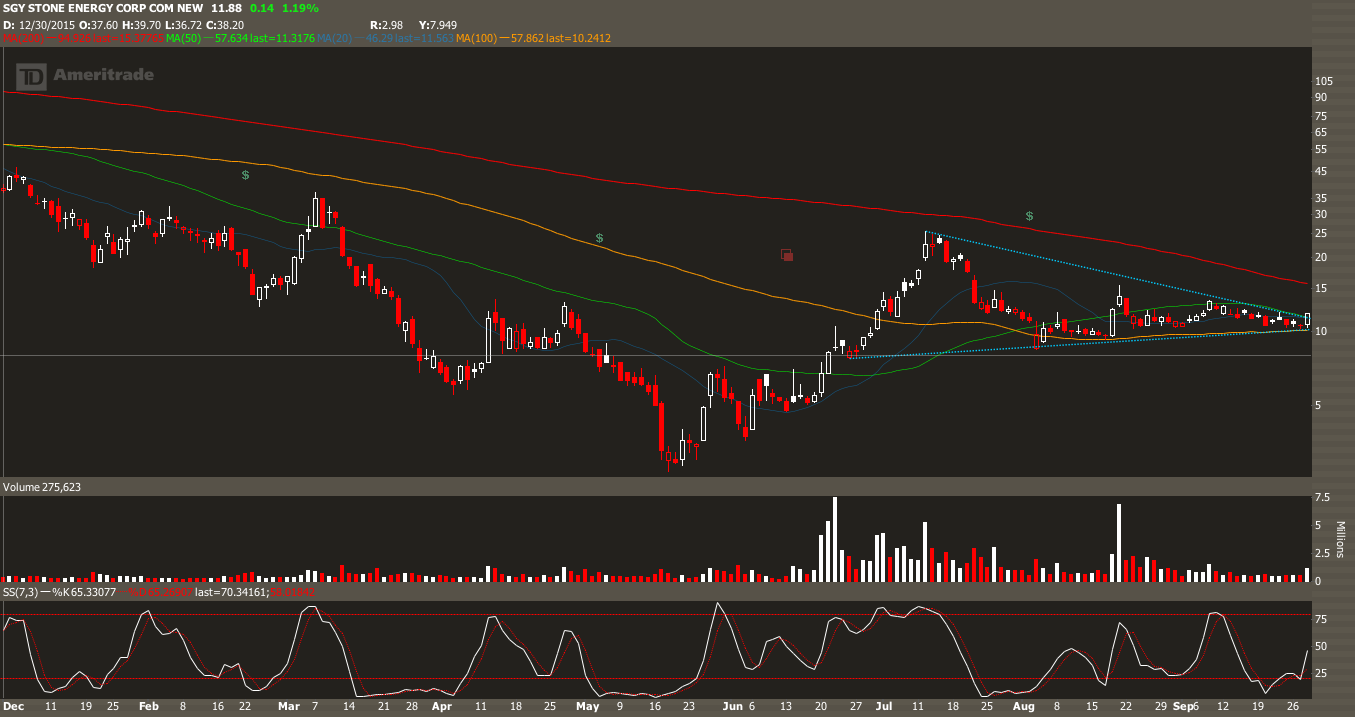
Here was the setup in $SGY, another name I traded in the room this week. This one was just about picture perfect on the daily. The stock was just about ready to breakout of the symmetrical triangle pattern when oil started to ramp:
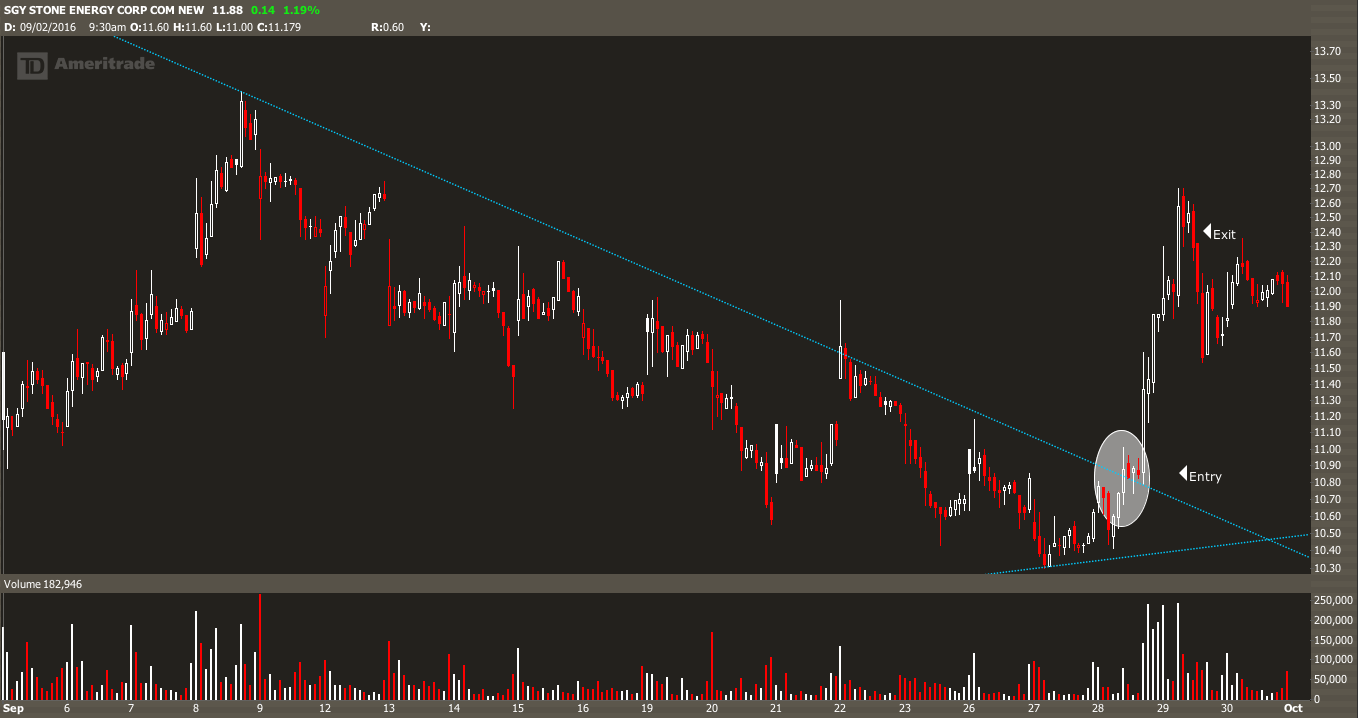
I knew with oil ripping this one had to break, here’s the entry and exit:
 __
__
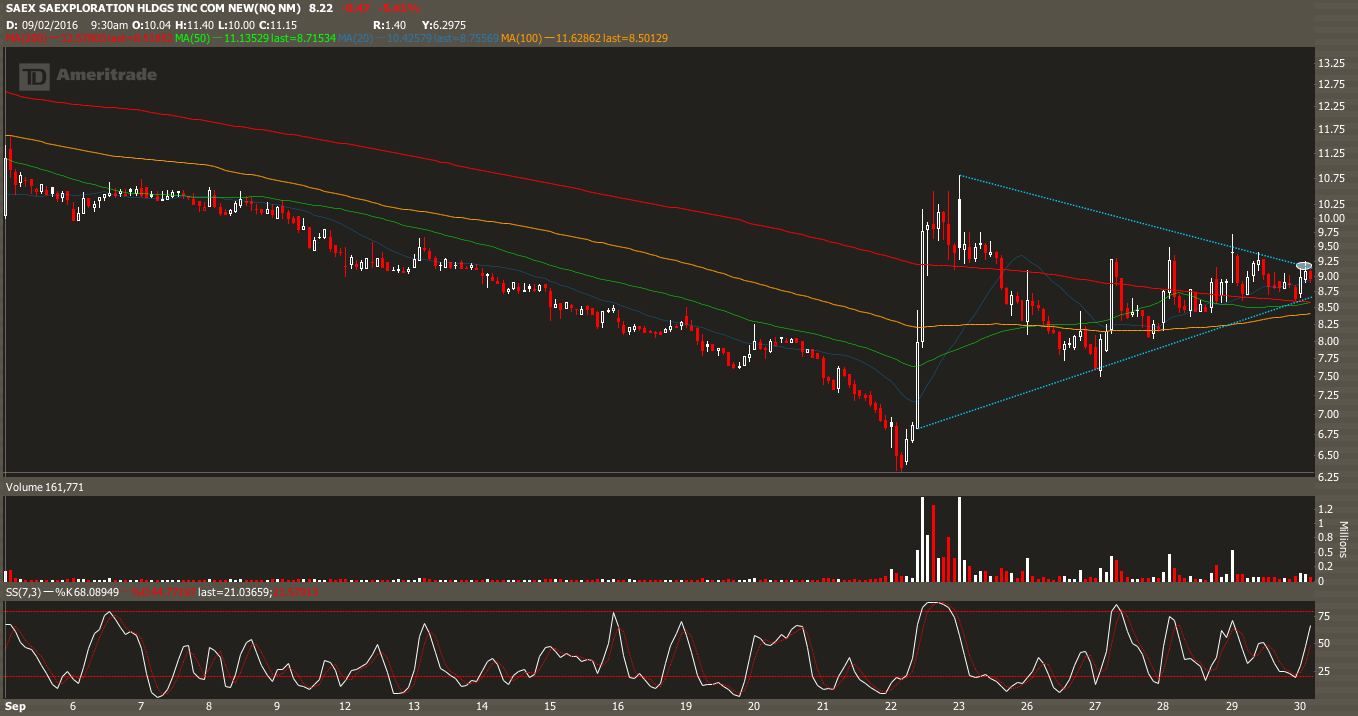
And, then there was $SAEX this morning. I got a little too greedy with this low quality name, but the setup I look for was there. Here was the 30 min chart this morning, which I took right at the action point:
 __
__
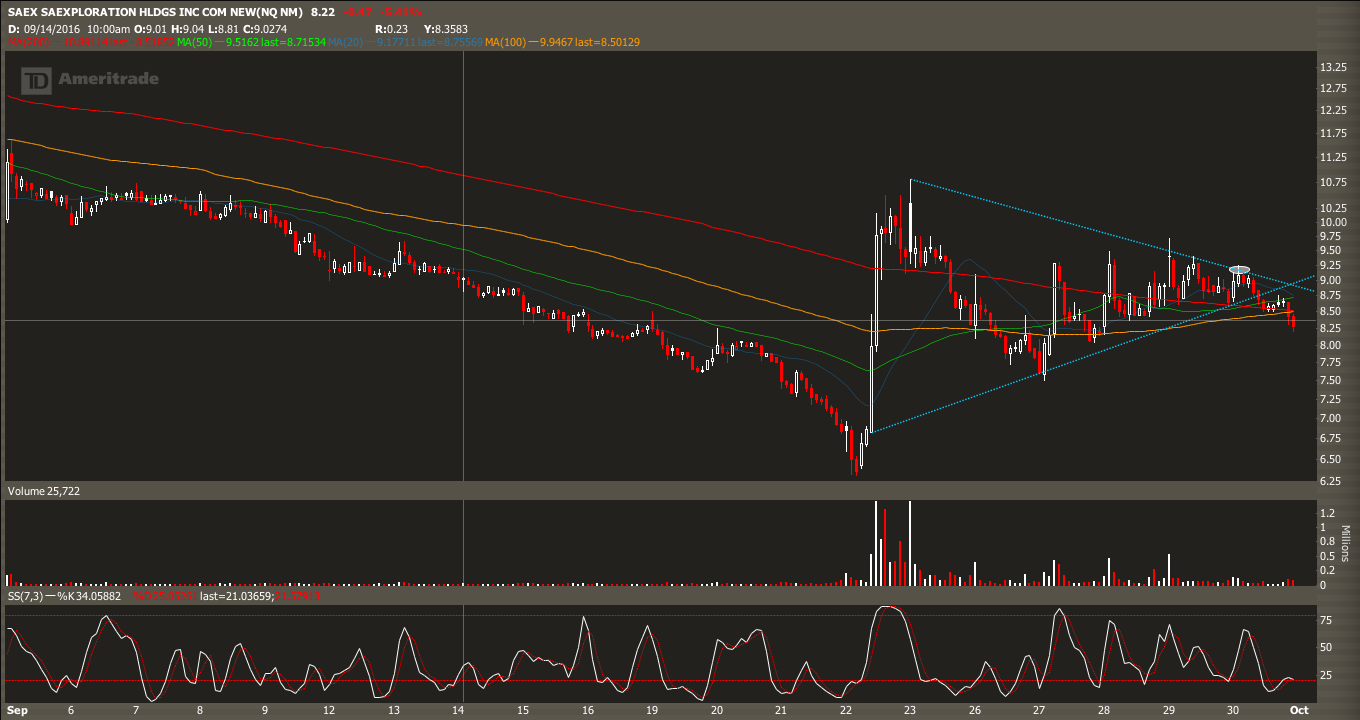
Unfortunately, this trade didn’t work and gave it to much rope while oil was staying elevated. I stopped out for a loss on the day:
 __
__
Anyway, hope this gives you a little a little insight to The Pelican room, and what we do inside of the matrix we call Exodus. Now, go sign up for the free trial!