|
Proprietary Data Insights Financial Pros Top Inverse ETF Searches November
|
||||||||||||||||||
|
Two Types of Market Divebombs When markets faceplant, it comes from a systemic failure or concern that extends beyond one sector. These come in two flavors: black swans and bubbles. Black swans are unpredictable events that aren’t worth trying to forecast because they come out of nowhere. Covid is a great example. Bubbles form in parts of the market when speculation runs rampant. What you may not realize is that bubbles pop all the time without taking down global economies. It’s only when you get a cascade failure, whether because of the scope of the bubble or the perfect alignment of circumstances, that we get true market crashes. We can certainly point to meme stocks, cryptocurrencies, and even equities themselves as bubbly. What we don’t know is whether any of these can infect the broader markets and economies to create true bear markets. That’s why we do our homework and stay on top of the news. |

|
Stock Market |
How Common Are Market Pullbacks? |
Key Takeaways
Recent market action put everyone on edge. We know stocks drop from time to time. But how common are pullbacks? Raw Data Market pullbacks are defined as ‘corrections’ when they exceed 10% from peak to trough and ‘bear markets’ at 20%. In the last 76 years the S&P 500 saw:
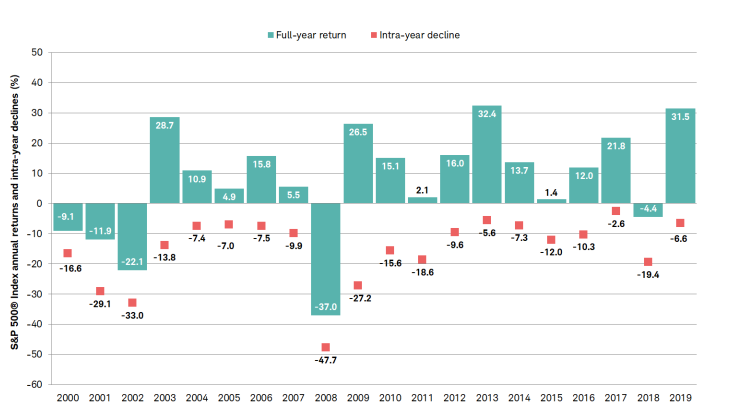
Essentially, you are bound to get a decline of 5% or more at least once a year and a correction once every 3 years. Recent Trends Are More Volatile Charles Schwab put together an excellent graphic that shows the intra-year decline by year over the last two decades (excluding 2020-2021). The graph tells us that in the last two decades, markets experienced more volatility than they had historically in terms of declines. We know this because of those major market drops of +40%, two happened in the last two decades (1973, 2001, 2008). Surprisingly, the 2020 decline didn’t quite get to 40% before it bounced. Reserve Capital To Deploy Most pullbacks last a few months. And even bear market corrections take about a year to work themselves out. Long-term investors struggle the most with corrections of +40% just because they can take years to recover. That’s why the data suggests that investors should always keep a portion of their capital in cash, ready to deploy it during downturns. You can do this by either reserving a portion of your assets in cash or making regular contributions to your portfolio. By purchasing as markets decline, you lower your average price per share, known as dollar-cost-averaging (a concept promoted by Warren Buffet). The Bottom Line: Top to bottom, the S&P 500 only dropped a bit more than 5% this go around. That’s par for the course. From 2010-2020 we saw corrections of +10% about once every other year. So, if we don’t see one this year, it’s quite likely one is just around the corner. However, that doesn’t mean markets can’t go higher first. |