Mortgage applications decreased 8.1 percent from one week earlier, according to data from the Mortgage Bankers Association’s (MBA) Weekly Mortgage Applications Survey for the week ending March 18, 2022.
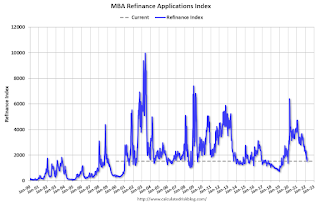
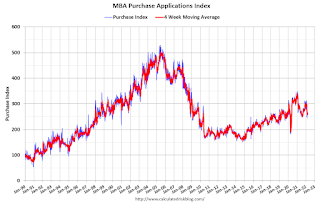
… The Refinance Index decreased 14 percent from the previous week and was 54 percent lower than the same week one year ago. The seasonally adjusted Purchase Index decreased 2 percent from one week earlier. The unadjusted Purchase Index decreased 1 percent compared with the previous week and was 12 percent lower than the same week one year ago.
“Rates on 30-year conforming mortgages jumped by 23 basis points last week, the largest weekly increase since March 2020. The jump in rates comes as markets moved to price in a much faster pace of rate hikes, as well as expectations of fewer MBS purchases from the Federal Reserve. With mortgage rates now at 4.5 percent, compared to rates at or below 3 percent not that long ago, it is no surprise that refinance volume has dropped by more than 50 percent compared to this time last year. MBA’s new March forecast expects mortgage rates to continue to trend higher through the course of 2022,” said Mike Fratantoni, MBA’s Senior Vice President and Chief Economist. “Purchase application volume was down slightly for the week, with a larger drop in FHA and VA purchase volume, and a small decline in conventional purchase loans. First-time homebuyers, who rely on these government programs, are increasingly challenged by both the rapid increase in home prices and higher mortgage rates. Repeat homebuyers, who are more likely to use conventional loans, benefit from the gains in home equity realized on a sale which can be used to fuel their next purchase, even with rates moving higher.”
…
The average contract interest rate for 30-year fixed-rate mortgages with conforming loan balances ($647,200 or less) increased to 4.50 percent from 4.27 percent, with points increasing to 0.59 from 0.54 (including the origination fee) for 80 percent loan-to-value ratio (LTV) loans.
emphasis added

The first graph shows the refinance index since 1990.
