On COVID (focus on hospitalizations and deaths):
 Click on graph for larger image.
| COVID Metrics | ||||
|---|---|---|---|---|
| Now | Week Ago |
Goal | ||
| Percent fully Vaccinated | 65.7% | — | ≥70.0%1 | |
| Fully Vaccinated (millions) | 218.1 | — | ≥2321 | |
| New Cases per Day3🚩 | 26,595 | 25,362 | ≤5,0002 | |
| Hospitalized3 | 10,164 | 11,990 | ≤3,0002 | |
| Deaths per Day3 | 496 | 637 | ≤502 | |
| 1 Minimum to achieve “herd immunity” (estimated between 70% and 85%). 2my goals to stop daily posts, 37-day average for Cases, Currently Hospitalized, and Deaths 🚩 Increasing 7-day average week-over-week for Cases, Hospitalized, and Deaths ✅ Goal met. |
||||
 Click on graph for larger image.
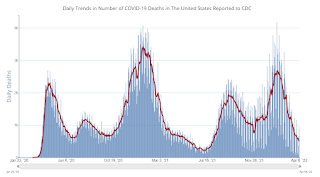
This graph shows the daily (columns) and 7-day average (line) of deaths reported.
Hospitalizations and deaths are declining.
Average daily deaths are the lowest since August 1st, 2021. The pandemic low (after initial surge) was just over 200 in July 2021.