Take a close looks at the eighteen red dots in the chart above by Jason Goepfert of Sentimentrader: 1987, 1990, 1998, 2008-2009, 2018-2019, 2020. Breadth readings this bad – this many stocks hitting 52-week lows on the NYSE and NASDAQ – have almost always come at meaningful lows. While there are no guarantees, I see no reason why this time is different. Therefore the probabilities suggest that a meaningful low is near.

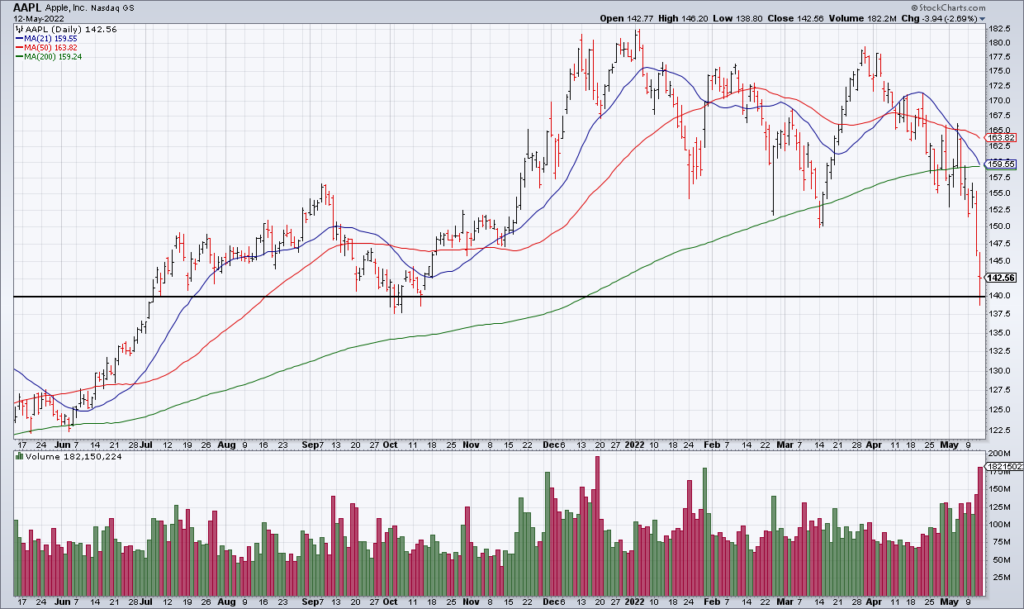
I do not believe the bear market is anywhere close to being over from a time standpoint but serious price damage has been done – especially to speculative tech stocks (take a look at a chart of ARKK). While the generals like AAPL and GOOG/GOOGL are 20%-30% off their all time highs – and likely have further to go – many speculative tech stocks are off 80%-90%. While some will go to zero, many of them are now attractively priced from a long term perspective. They are no longer shorts in my opinion.
To be clear, this is no normal bear market. In fact, I believe the top in November 2021 is similar to the top in October 1929 – from which it took 25 years for the Dow Jones Industrial Average to make a new high. However, history rhymes but does not repeat. I do not believe the Fed will sit by and watch the major averages drop the way it did during The Great Depression. That would be contrary to everything it has done in recent decades and I see no evidence of an abrupt about face.