Here is a graph of retail hiring for previous years based on the BLS employment report:

This graph shows the historical net retail jobs added for October, November and December by year.
Retailers hired about 700 thousand seasonal workers last year (using BLS data, Not Seasonally Adjusted), and 224 thousand seasonal workers last October.
Note that in the early ’90s, retailers started hiring seasonal workers earlier – and the trend towards hiring earlier has continued.
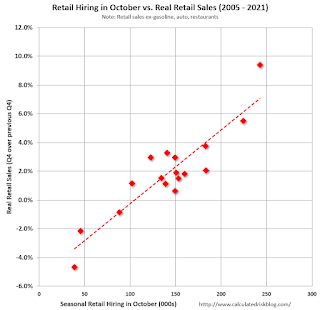
The following scatter graph is for the years 2005 through 2021 and compares October retail hiring with the real increase (inflation adjusted) for retail sales (Q4 over previous Q4).

NOTE: The dot in the upper right – with real Retail sales up almost 10% YoY is for 2020 – when retail sales soared due to the pandemic spending on goods (service spending was soft).