 Note: Mortgage rates are from MortgageNewsDaily.com and are for top tier scenarios.
On COVID (focus on hospitalizations and deaths). Data is now weekly.
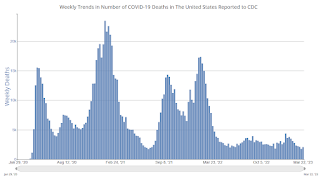
The winter surge was much smaller in 2023 than for the previous two years, and hopefully cases, hospitalizations and deaths will set new pandemic lows soon.
| COVID Metrics | ||||
|---|---|---|---|---|
| Now | Week Ago |
Goal | ||
| New Cases per Week2 | 133,521 | 153,183 | ≤35,0001 | |
| Hospitalized2 | 15,705 | 17,594 | ≤3,0001 | |
| Deaths per Week2🚩 | 2,060 | 1,753 | ≤3501 | |
| 1my goals to stop weekly posts, 2Weekly for Cases, Currently Hospitalized, and Deaths 🚩 Increasing number weekly for Cases, Hospitalized, and Deaths ✅ Goal met. |
||||
 Click on graph for larger image.
This graph shows the weekly (columns) number of deaths reported.
After the first few weeks, the pandemic low for weekly deaths was the week of July 7, 2021, at 1,690 deaths. For cases, the low was 82,186.
For hospitalizations, the low was 9,821.