Demand for office space extended its downward trend in Q1 as companies adjusted to uniquely designed hybrid models and strategically consolidated real estate space to improve operating margins. At the national level, more than 5 million square feet (sqft) was released back to the market this quarter. Meanwhile, construction slowed further with just over 3 million sqft of new space delivered in Q1. Vacancy rose to 19.0%, up 20 bps from a quarter-ago due to oversupplied stock and exceeding the pandemic peak of 18.5%. Office vacancies rose for the 5th consecutive quarter, another step closer to its historic peak of 19.3% in 1991. Asking rents increased by 0.4% in Q1 despite the rise in vacancies, likely an outcome of inflationary pressures.
The pandemic has accelerated market trends regarding how and where we work. Hybrid models have readily become adopted, though significant portions of the market remain either entirely in person or remote. With individual firms adopting competing models for specific business needs, a universal standard has yet to emerge. 2023 is poised to be a year of adaptation, or even innovation, as firms weigh their choices among location, size, and amenities given increased availability.
emphasis added
 Click on graph for larger image.
This graph shows the office vacancy rate starting in 1980 (prior to 1999 the data is annual).
And from Moody’s on Retail:
Retail suffered the most when the Great Financial Crisis (GFC) hit in 2008. Oversupply and three years of negative retail net absorption increased the average vacancy from 6-7% to 10-11%. Since then, several factors weakened supply growth: developers became more cautious, demand dampened with the rise of e-commerce, and consumer preferences gradually changed. COVID-19 and the upsurge of remote work exacerbated retail woes, but this shock did not cause a freefall similar to the GFC because the sector was stumbling in the decade leading up to the pandemic. According to the latest Census Advanced Monthly Retail Trade Survey, total sales in February were up 5.4% from the same period a year ago, with food service/drinking places and general merchandise stores enjoying double-digit growth.
Supported by resilient consumer spending, neighborhood and community shopping center performance remained stable. However, with consumer confidence index starting to show subtle changes in consumers’ spending plan with less incentive towards service and stationary spending over the next six months, new retail construction and net absorption both came in light for the first quarter of the year. Vacancy flatlined at 10.3% over the past four quarters. Asking/effective rents were up slightly by 0.2%/0.3% in Q4 and remained in the $21/$18-per-sqft range, a level unchanged since 2018.

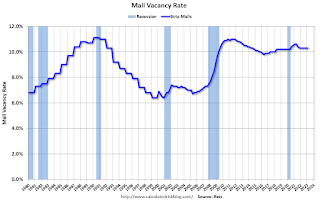
In the mid-’00s, mall investment picked up as mall builders followed the “roof tops” of the residential boom (more loose lending). This led to the vacancy rate moving higher even before the recession started. Then there was a sharp increase in the vacancy rate during the recession and financial crisis.