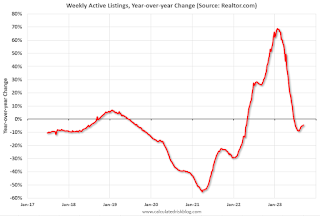
• Active inventory declined, with for-sale homes lagging behind year ago levels by 4.4%.
During the past week, we observed the 13th successive drop in the number of homes available for sale when compared to the previous year. This decline showed a slight improvement compared to the previous week’s -5.1% figure.
• New listings–a measure of sellers putting homes up for sale–were down again this week, by 6.0% from one year ago.
Over the past 63 weeks, we’ve consistently seen a decline in the number of newly listed homes compared to the same period one year ago. However, this gap in new listings has been gradually narrowing over the past few weeks. This shift comes as the market recovers from more significant declines experienced last year, which were triggered by the steady increase in mortgage rates affecting the real estate landscape.
In the most recent week, the decrease in newly listed homes was 6.0% compared to the previous year, showing improvement from the 7.1% decline in the week prior.

Inventory was down 4.4% year-over-year – this was the thirteenth consecutive week with a YoY decrease following 58 consecutive weeks with a YoY increase in inventory.