The TSA is providing daily travel numbers.
 Click on graph for larger image.
This data is as of November 26th.
 Click on graph for larger image.
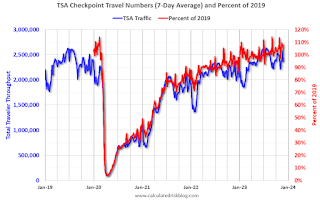
This data shows the 7-day average of daily total traveler throughput from the TSA (Blue).
The red line is the percent of 2019 for the seven-day average.
The 7-day average is above the level for the same week in 2019 (104% of 2019). (red line) The 7-day average has been above 2019
Air travel – as a percent of 2019 – is tracking above pre-pandemic levels.