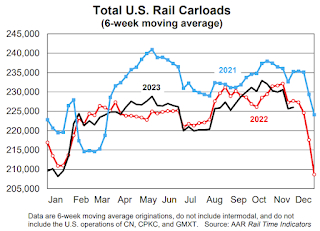
In the first 11 months of 2023, total carloads were 10.82 million, up 0.2% (21,700 carloads) over last
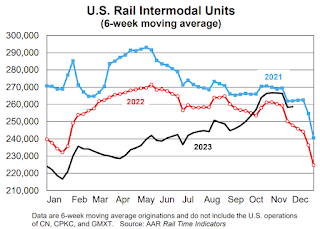
year and up 0.5% (53,682 carloads) over 2021. … In 2023 through November, intermodal originations
totaled 11.68 million, down 6.0% (748,046 units) from 2022 and down 10.6% (1.39 million units) from 2021.
emphasis added

This graph from the Rail Time Indicators report shows the six-week average of U.S. Carloads in 2021, 2022 and 2023:
Total originated carloads on U.S. railroads fell
0.01%, or 102 carloads, in November 2023 from the
equivalent period in 2022. It was the fifth year-over-year
decline for total carloads in the past six months, but most
of those declines have been very small in percentage
terms. Total carloads averaged 225,715 per week in
November 2023, the fourth lowest of the 11 months so far
this year. The Thanksgiving holiday typically holds down
rail volumes in November.

U.S. intermodal volume was up 5.0% in November
2023, its third straight year-over-year gain after 18 straight
declines and the biggest year-over-year percentage gain
for intermodal in 29 months. U.S. railroads averaged
255,981 originated containers and trailers per week in
November 2023. That’s the fourth highest average
intermodal volume for November on record (2017, 2018,
and 2020 were higher).