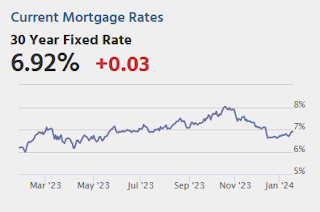
 Note: Mortgage rates are from MortgageNewsDaily.com and are for top tier scenarios.
Due to changes at the CDC, weekly cases are no longer updated.
For deaths, I’m currently using 4 weeks ago for “now”, since the most recent three weeks will be revised significantly.
Hospitalizations have more than quintupled from a low of 5,150 in June 2023.
Hospitalizations are about 20% of the peak of 150,000 in January 2022.
| COVID Metrics | ||||
|---|---|---|---|---|
| Now | Week Ago |
Goal | ||
| Hospitalized2 | 27,882 | 29,807 | ≤3,0001 | |
| Deaths per Week2🚩 | 1,768 | 1,712 | ≤3501 | |
| 1my goals to stop weekly posts, 2Weekly for Currently Hospitalized, and Deaths 🚩 Increasing number weekly for Hospitalized and Deaths ✅ Goal met. |
||||
 Click on graph for larger image.
This graph shows the weekly (columns) number of deaths reported.
Weekly deaths have more than tripled from a low of 485 in early July. Still weekly deaths are far below the weekly peak of 26,000 in January 2021.