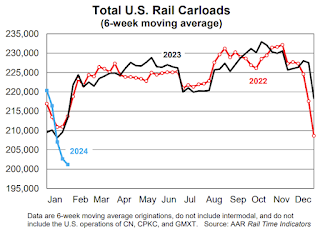
In January, severe winter weather significantly disrupted railroad and rail customer operations
in much of the country. Moreover, uncertainty remains in the economy, especially in sectors that are
important to railroads, like manufacturing. Because of these factors, January is not necessarily a
harbinger of what’s to come for rail traffic in the months ahead. That’s important to note, because total
carloads on U.S. railroads fell 7.2%, or 79,725 carloads, in January 2024 from January 2023. It’s the largest
year-over-year percentage decline for total carloads since February 2021 (another month when rail
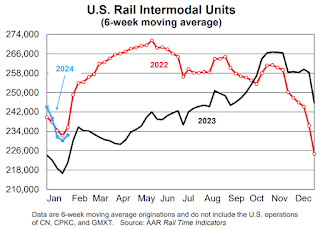
volumes were impacted by severe winter weather).Intermodal (which is not included in carloads) fared better in January: intermodal originations
were up 5.5% over last year, their fifth consecutive gain following 18 consecutive declines. Gains in
intermodal are partly due to higher port volumes over the past six months
emphasis added

This graph from the Rail Time Indicators report shows the six-week average of U.S. Carloads in 2022, 2023 and 2024:
n January, U.S. railroads (excluding the U.S.
operations of Canadian and Mexican railroads) originated
1.03 million total carloads, down 7.2% (79,725 carloads)
from January 2023. Total carloads averaged 205,034 per
week in January 2024, the smallest weekly average for
January in our records that go back to 1988. (Since 1988,
six months overall had lower weekly average carloads,
most recently December 2022.)

Intermodal fared better than carloads in January:
intermodal originations totaled 1.21 million containers and
trailers, up 5.5% (63,195 units) over January 2023. That’s
intermodal’s fifth consecutive year-over-year monthly
gain following 18 consecutive declines.