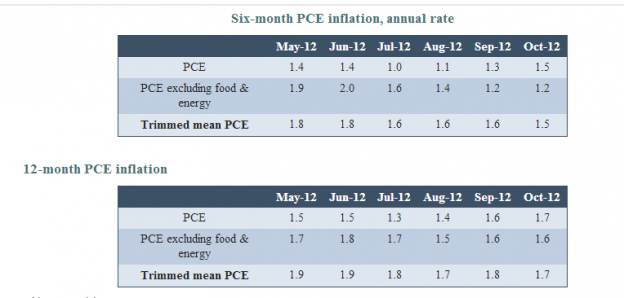
The Dallas Fed reported a few minutes ago the 12mo Trimmed Mean PCE for October at 1.7%-see the tables of data below. Several months ago I reported this inflation number and its 6mo trend with the expectation that we should begin to see a gently falling inflation rate. We are seeing this occur. The 6mo data trend continues to suggest that we remain in a gently easing inflation scenario with a potential target of 1.5% or so by mid-2013. The importance of this has multiple impacts for investors.
The drop in inflation from 1.9% in June 2012 to 1.5% by perhaps June 2013 by itself in not terribly significant. What is significant is that the direction is down and not up! For several years a significant bet has been made on oil, gold, copper and other hard assets were to see a sharp rise due to the financial mismanagement in the US economy and rampant inflation being the result. This does not appear to be occurring even with the daily discussions surrounding the “Fiscal Cliff”. Inflation has remained tame as consumers have preferred to hold cash rather than spend and government has also begun to slow its spending trend. Should inflation continue to decline, then those investments in hard assets which were based on the expectation of hyper-inflation will likely be reversed and historically this has resulted in higher equity markets.
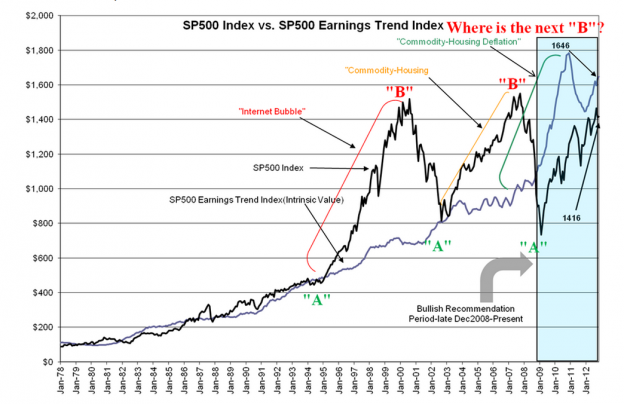
The other impact comes from the historical pricing of the SP500 Earnings Trend Index. The SP500 Earnings Trend Index reflects the levels at which Value Investors buy the S&P 500 (S&P Indices:.INX). This is tied to the Prevailing Rate which is the long term trend of Real GDP at 3.02% in today’s market combined with the current inflation measure. Last month the Prevailing Rate fell to 4.72% from the previous month’s 4.82%. Capitalizing the current value from the SP500 Earnings Trend of $77.71 gives a value for the SP500 Earnings Trend Index of $1646. As of Nov 30, 2012 the S&P 500 (S&P Indices:.INX) would have to rise 16% to equal its “Intrinsic Value”. Historically investors have supported the SP500 at this “Intrinsic Value” as one can see in the S&P 500 (S&P Indices:.INX) t0 chart below. Today’s discount to this level indicates a market which is undervalued.

Falling inflation is good for stocks and optimism remains warranted in my analysis.
The post Inflation Slows As S&P 500 Gets Cheaper appeared first on ValueWalk.

