Apple has gone from the first ever 1-trillion dollar baby to stock investors can’t sell fast enough. Is Apple’s sell off overdone? Here’s one key point and a piece of technical analysis that may well hold the answer.
Downhill, up the creek, or to new highs? What’s next for Apple?
The iPad is selling like hotcakes, the iPad Mini tops many holiday wish lists, and Apple is projected to sell 53 million iPhones this quarter, a 40+% increase from Apple’s previous one-quarter record of 37 million.
Considering those numbers, is Apple’s recent 28% drop overdone?
That’s the wrong question. A better question is whether Apple’s run to its $705 all-time high was simply overdone?
The Disconnect between Sales an AAPL Shares
A September 18 article here on iSPYETF addressed an obvious but ignored math flaw in AAPL shares three days before the stocks all-time high. Here’s what I mean:
On September 13, Apple unveiled the new iPhone.
On September 17, Apple sent out an e-mail announcing that iPhone 5 pre-orders topped two million.
From September 13 – 17, AAPL soared 3.5%. Did this move make sense? Let’s calculate:
The profit margin on the iPhone is about 58% (according to a document obtained by Reuters). The average price is $299. The profit on 2 million iPhones sold at $299 is $347 million.
The 3.5% September 13 – 17 rally increased Apple’s market cap by some $24 billion.
Did anything material change in Apple’s fundamentals to validate this rally? No. The same article warned that Apple is due for a reality check, which will drag down the Nasdaq and technology sector.
So is Apple’s decline overdone?
Flawed Math is No Indicator
We surely won’t get the answer from Apple’s (holiday) sales. The math didn’t work on the up side and it won’t work on the down side.
Three factors that likely contributed to the most recent leg down are:
1) Profit taking before a seemingly inevitable tax increase.
2) The psychological effect of the death cross (although it’s not always as bearish as it sounds).
3) The increase of margin requirements by some clearing firms.
The most important factor is simply that the higher a stock rallies, the further it can fall. Apple’s run from below 20 in 2004 to above 700 in 2012 was just “too much of a good thing.”
Despite the set back, AAPL is still up 33% YTD and Apple’s market cap still $100 billion bigger than its closest market cap competitor.
Short-term Technical Outlook
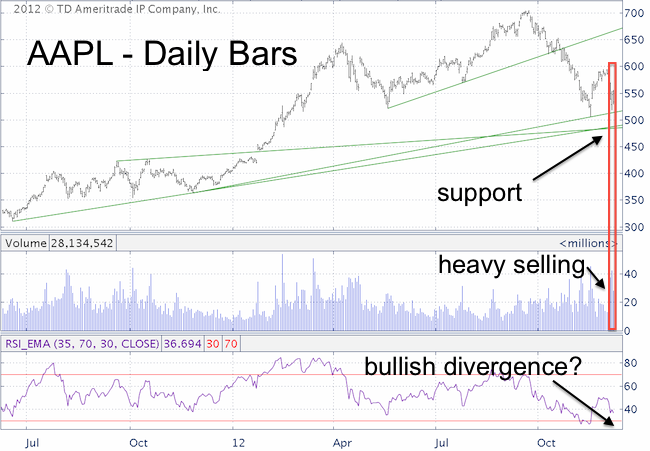
Technical analysis of Apple and the AAPL chart warned of a top above 700 and a bounce of the November 16 low at 506 (summary of my Apple analysis can be found here).
The current chart is somewhat inconclusive, but selling has been heavy (see chart) and it seems to me that Apple is heading for a new low, perhaps around 480 – 490. Nevertheless, the down side seems limited and a new low unconfirmed by a new RSI low would create a bullish divergence and possibly prove as a springboard for a more sustainable rally into Q1 2013 (even without new low AAPL is likely to rally in Q1 2013).
