QE1, QE2, QE3, expiring Operation Twist, and now QE4. Which of those programs are “sterilized” (non-inflationary) and which ones devalue the dollar? If you’ve lost track, here’s a quick visual summary.
Will Operation Twist be replaced by outright QE was a question addressed here early in December. As it turns out, the Fed decided to do just that.
We now have multiple layers of QE working simultaneously. What’s the total amount being spent and will inflation finally take off?
QE Tally
There are three official tranches of quantitative easing (QE):
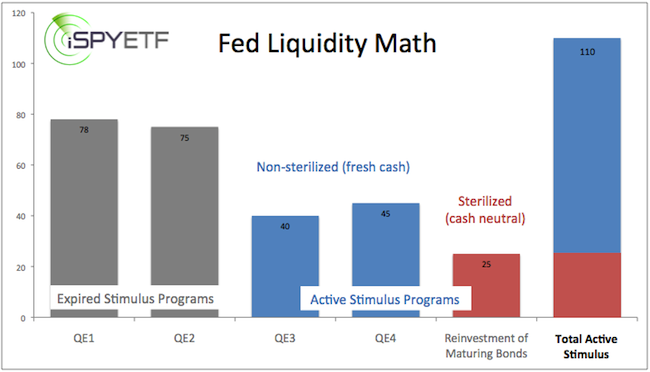
1) QE3, announced on September 13, 2012. The Federal Reserve will buy $40 billion per month worth of mortgage-backed securities.
2) QE4, announced on December 12, 2012. The Federal Reserve will buy $45 billion per month worth of longer term Treasuries (corresponding ETF: iShares Barclays 20+ Treasury ETF – TLT).
QE4 will be replacing Operation Twist in 2013. Operation Twist is considered “sterilized” or cash neutral QE. Operation Twist simply reshuffled the balanced sheet (sell shorter term in favor of longer term maturities). It did not expand the balance sheet.
Unlike Operation Twist, QE4 will be financed by “non-sterilized” or freshly printed money. This process increases the Federal Reserve’s balance sheet and the amount of money in circulation.
3) Reinvestment of maturing securities. In a December 12 press release, the Federal Reserve stated: “The Committee is maintaining its existing policy of reinvesting principal payments from its holdings mortgage-backed securities and, in January, will resume rolling over maturing Treasury at auction.” This amounts to roughly $25 billion/month of sterilized QE.
In total, the Federal Reserve will buy $110 billion worth of Treasuries and mortgage-backed securities every month until the unemployment rate drops below 6.5% and inflation remains below 2.5%.
The first chart below illustrates QE3, QE4, and reinvestments separately and how the three layers combined compare with QE1 and QE2.

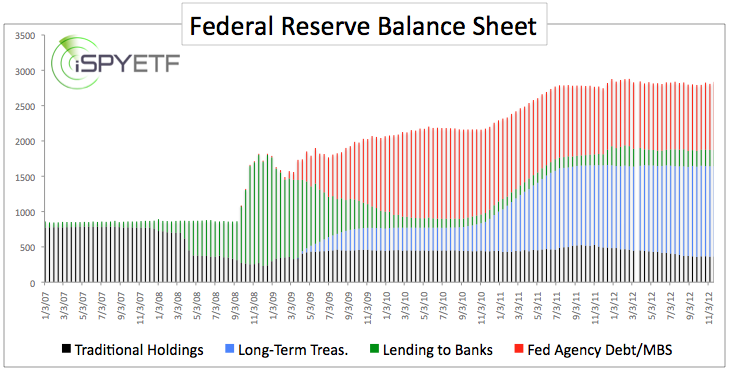
The second chart provides a more detailed glimpse of the Fed’s balance sheet (and a mere glimpse is all mere mortals are allowed).
The Fed’s balance sheet as of November 21, 2012 stood at $2.84 trillion and is expected to balloon another $1 trillion over the next 12 months.
Currently $966 billion or 34% are invested in agency debt, mainly mortgage-backed securities. In other words, one of every three dollars in circulation is backed by toxic assets, the same stuff that caused the “Great Recession.”
Inflation
Inflation, where art thou? The Fed’s balance sheet exploded from below $1 trillion to nearly $3 trillion, but inflation (let alone hyper inflation) has been a no show.
Will the current round of QE deliver on inflationist’s predictions? I doubt it.
