The BEA released the Personal Income and Outlays report for November:
Personal income increased $85.8 billion, or 0.6 percent … in November, according to the Bureau of Economic Analysis. Personal consumption expenditures (PCE) increased $41.3 billion, or 0.4 percent..
…
Real PCE — PCE adjusted to remove price changes — increased 0.6 percent in November, in contrast to a decrease of 0.2 percent in October. … The price index for PCE decreased 0.2 percent in November, in contrast to an increase of 0.1 percent in October. The PCE price index, excluding food and energy, increased less than 0.1 percent, compared with an increase of 0.1 percent.
Personal saving — DPI less personal outlays — was $436.7 billion in November, compared with $404.6 billion in October. The personal saving rate — personal saving as a percentage of disposable personal income — was 3.6 percent in November, compared with 3.4 percent in October.
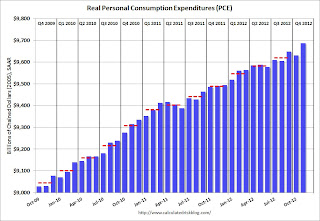
The following graph shows real Personal Consumption Expenditures (PCE) through November (2005 dollars). Note that the y-axis doesn’t start at zero to better show the change.
 Click on graph for larger image.
This graph shows real PCE by month for the last few years. The dashed red lines are the quarterly levels for real PCE. Personal income increased more than expected in November and PCE for October was revised up.
The “two month method” for estimating Q4 PCE suggests PCE will increase close to 2.2% in Q4 – more growth than most expect – although this estimate is probably a little high because PCE was strong in September. Still better than expected …