The economic data released this week was encouraging. The November Personal Income and Outlays report suggests PCE might increase over 2% in Q4 – not great, but higher than most forecasts.
The housing numbers were solid. Housing starts are on pace to increase about 25% this year, and, for existing homes, inventory is down sharply and conventional sales up.
Other positives include Q3 GDP being revised up, the highest Architecture Billings Index since 2007, a rebound in the trucking index, a decline in the 4-week average of initial weekly unemployment claims, and another increase in builder confidence.
Manufacturing was still weak, but two of the three regional surveys were slightly better than expected. A negative was consumer sentiment, and that is probably related to the “fiscal cliff” debate in Washington that is still showing no signs of progress. I expect an agreement, but not until early January (although it could happen sooner). Next week will be a light week for economic data, but there are two key housing reports – new home sales and Case-Shiller house prices.
Here is a summary of last week in graphs:
• Housing Starts at 861 thousand SAAR in November
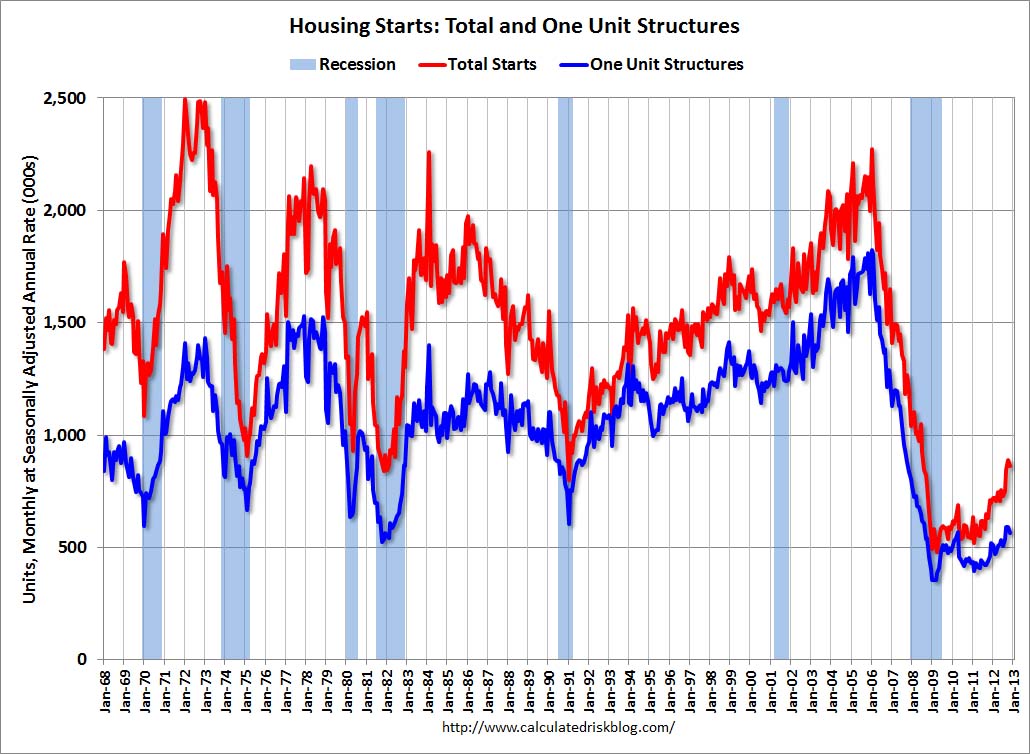 Total housing starts were at 861 thousand (SAAR) in November, down 3.0% from the revised October rate of 888 thousand (SAAR).
A few key points:
• Housing starts are on pace to increase about 25% in 2012. This is a solid year-over-year increase, and residential investment is now making a positive contribution to GDP growth.
• Even after increasing 25% in 2012, the approximately 770 thousand housing starts this year will still be the 4th lowest on an annual basis since the Census Bureau started tracking starts in 1959 (the three lowest years were 2009 through 2011). Starts averaged 1.5 million per year from 1959 through 2000, and demographics and household formation suggests starts will return to close to that level over the next few years. That means starts will come close to doubling from the 2012 level.
• Residential investment and housing starts are usually the best leading indicator for economy. Nothing is foolproof, but this suggests the economy will continue to grow over the next couple of years.
This was slightly below expectations of 865 thousand starts in November.
All Housing Investment and Construction Graphs
• Existing Home Sales in November: 5.04 million SAAR, 4.8 months of supply
 The NAR reports: November Existing-Home Sales and Prices Maintain Uptrend
This graph shows existing home sales, on a Seasonally Adjusted Annual Rate (SAAR) basis since 1993.
Sales in November 2012 (5.04 million SAAR) were 5.9% higher than last month, and were 14.5% above the November 2011 rate.
The next graph shows the year-over-year (YoY) change in reported existing home inventory and months-of-supply. Since inventory is not seasonally adjusted, it really helps to look at the YoY change. Note: Months-of-supply is based on the seasonally adjusted sales and not seasonally adjusted inventory.
 Inventory decreased 22.5% year-over-year in November from November 2011. This is the 21st consecutive month with a YoY decrease in inventory.
Months of supply declined to 4.8 months in November.
This was above expectations of sales of 4.90 million. For existing home sales, the key number is inventory – and the sharp year-over-year decline in inventory is a positive for housing.
All current Existing Home Sales graphs
• Personal Income increased 0.6% in November, Spending increased 0.4%
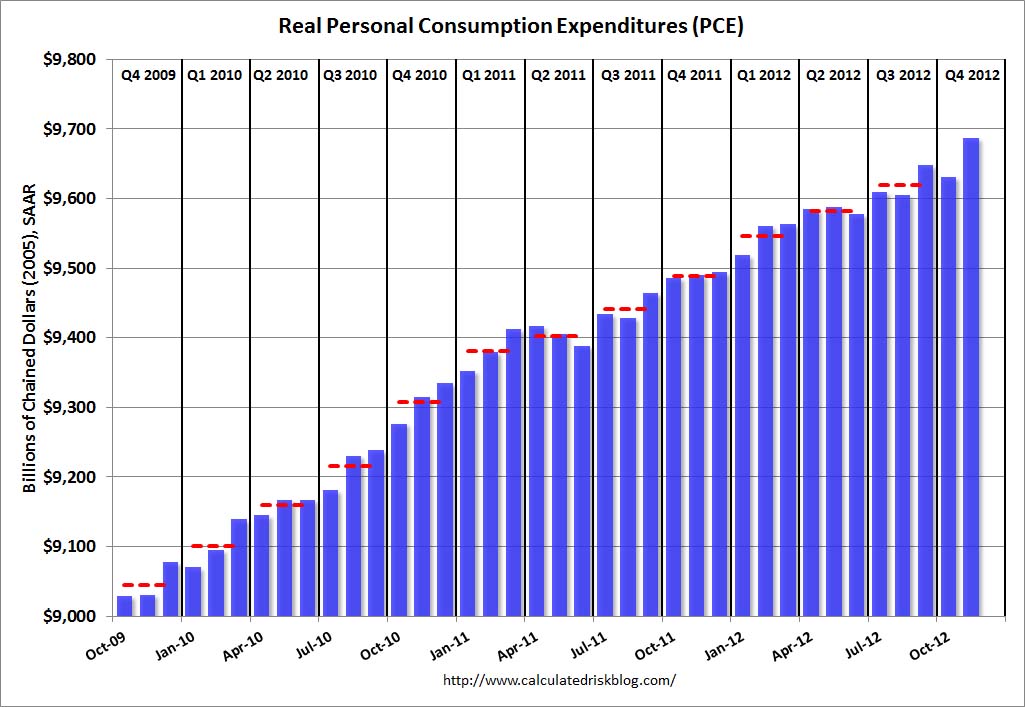 The BEA released the Personal Income and Outlays report for November.
This graph shows real PCE by month for the last few years. The dashed red lines are the quarterly levels for real PCE. Personal income increased more than expected in November and PCE for October was revised up.
The “two month method” for estimating Q4 PCE suggests PCE will increase close to 2.2% in Q4 – more growth than most expect – although this estimate is probably a little high because PCE was strong in September. Still better than expected, and we are already seeing some upward revisions to Q4 GDP forecasts.
• AIA: Architecture Billings Index increases in November, “Strongest conditions since end of 2007”
Note: This index is a leading indicator primarily for new Commercial Real Estate (CRE) investment.
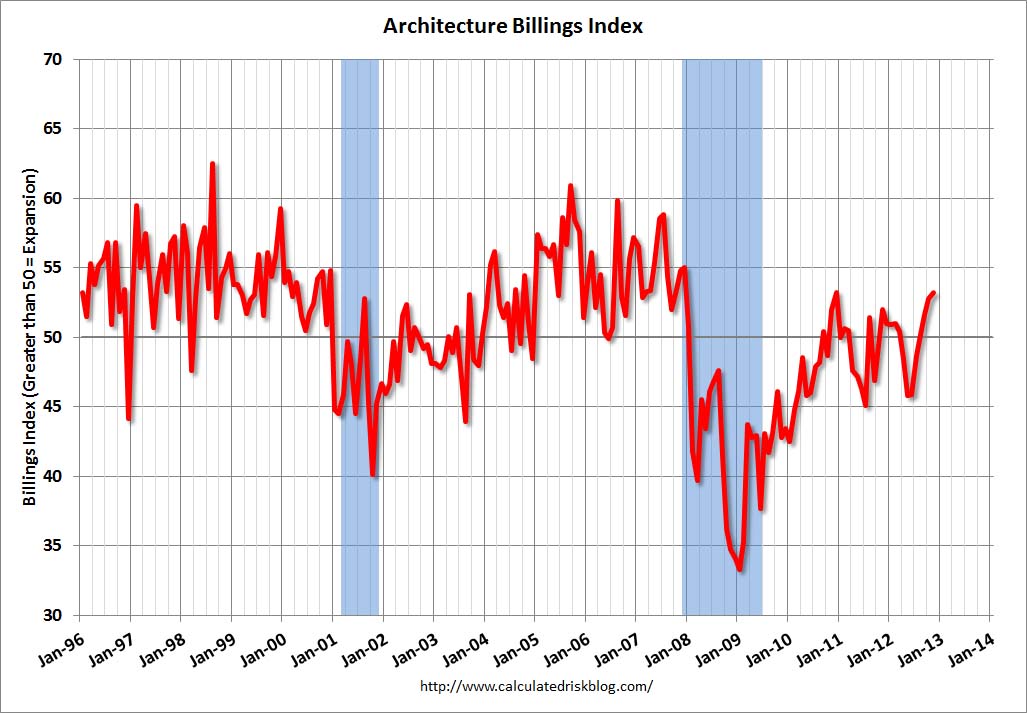 From AIA: Architecture Billings Index Signaling Gains for Fourth Straight Month
This graph shows the Architecture Billings Index since 1996. The index was at 53.2 in November, up from 52.8 in October. Anything above 50 indicates expansion in demand for architects’ services.
This increase is mostly being driven by demand for design of multi-family residential buildings, but every building sector is now expanding. New project inquiries are also increasing. Note: This includes commercial and industrial facilities like hotels and office buildings, multi-family residential, as well as schools, hospitals and other institutions.
• Weekly Initial Unemployment Claims at 361,000
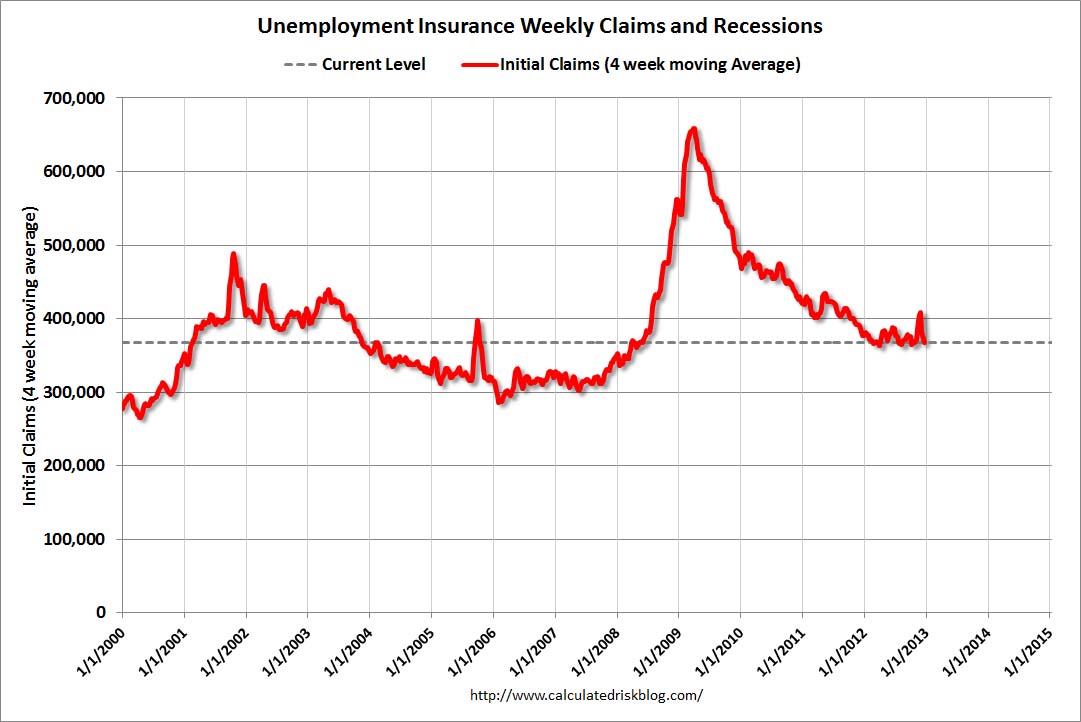 “In the week ending December 15, the advance figure for seasonally adjusted initial claims was 361,000, an increase of 17,000 from the previous week’s revised figure of 344,000.”
The dashed line on the graph is the current 4-week average. The four-week average of weekly unemployment claims declined to 367,750.
The recent spike in the 4 week average was due to Hurricane Sandy as claims increased significantly in NY, NJ and other impacted areas. Now, as expected, the 4-week average is back to the pre-storm level.
Weekly claims were slightly higher than the 359,000 consensus forecast.
All current Employment Graphs
• Final December Consumer Sentiment declines to 72.9
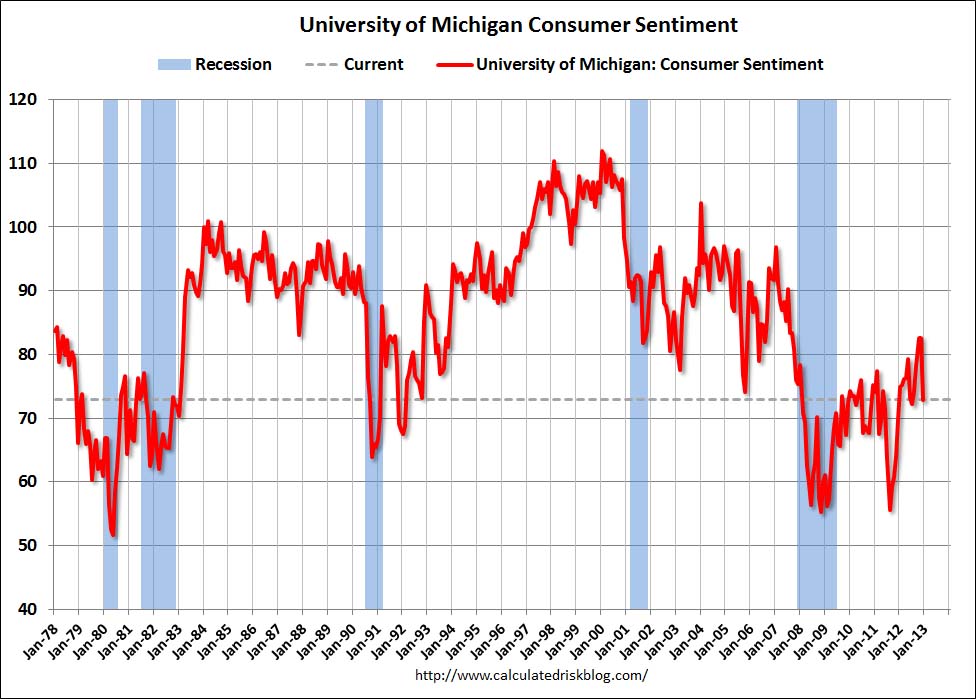 The final Reuters / University of Michigan consumer sentiment index for December declined to 72.9, down from the preliminary reading of 74.5, and was down from the November reading of 82.7.
This was below the consensus forecast of 75.0. The recent decline in sentiment is probably related to Congress and the so-called “fiscal cliff”. This is similar to the sharp decline in 2011 when Congress threatened to force the US to default (not pay the bills).
I still think an agreement will be reached in early January – there is no drop dead date – but you never know.