[I added some graphs to the previous post on income and government spending. Many readers assumed I was trying to explain why some countries are richer than others. Not so. I did that elsewhere. Also, I recently did a NGDP targeting post for FT Alphaville, in case anyone is interested.]
Some commenters criticized me for putting the term ‘lunatic’ in the title of a recent post. I suppose they are right. But first let me explain. Suppose back during the Zimbabwe hyperinflation someone had complained about the excessively contractionary nature of Zimbabwean monetary policy, and insisted that a more expansionary policy was needed. Would anyone object to me calling them a “lunatic.” Zimbabwe has had the most inflation of any country during recent decades.
The country with the least inflation is Japan, a country still in the throes of deflation. So if it would be crazy to call Zimbabwean policy too contractionary during their hyperinflation, why isn’t it crazy to call Japanese policy too expansionary?
But of course there must be more to it that that. All of the people cited in the article are brilliant; there isn’t a lunatic among them. So how could they hold seemingly loony opinions?
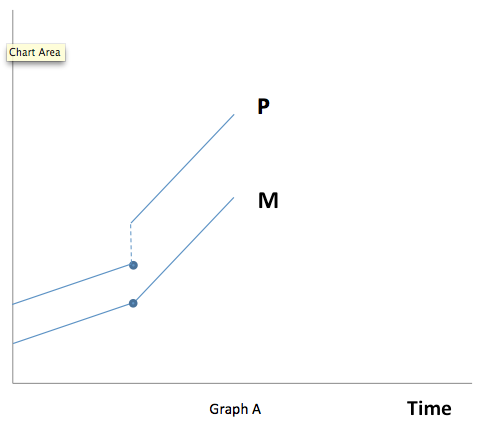
It might be based on something I learned from reading Milton Friedman back in 1972, when I was in high school. When you change the growth rate of the money supply, something kind of strange happens. The equilibrium price level jumps discontinuously. Consider Graph A, where the money supply growth rate increases. This will lead to higher inflation, and higher inflation expectations. The higher inflation expectations will lead to lower real money demand, which causes a discontinuous jump in the equilibrium price level. So prices rise faster than the money supply, when the money supply growth rate increases. (Or velocity rises, if you prefer that terminology.) And this is true even if money is 100% neutral in terms of once-and-for-all changes in the money supply. There is a ton of data (Cagan, etc) supporting this graph. Of course in the real world the price level doesn’t jump discontinuously to the new equilibrium, as some prices are sticky. But the basic idea is true.
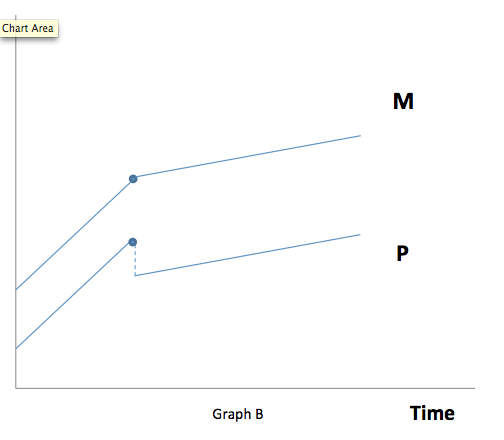
Conversely a slowdown in the money supply growth rate causes a discontinuous drop in the price level, followed by a slower rate of inflation (Graph B.)
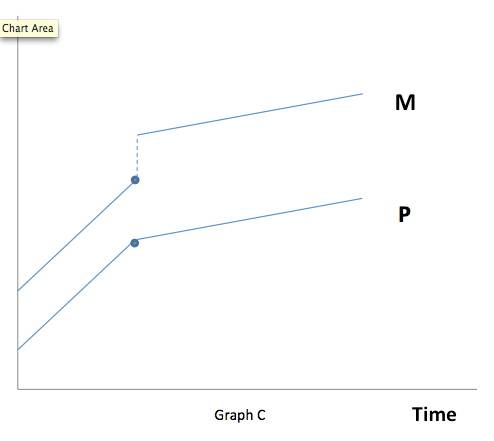
But central banks don’t like to do policies that would cause a discontinuous drop in the price level. They are destabilizing. So more likely if you were to slow the rate of money growth, you’d have a once-and-for all jump in the money supply to accommodate the extra real money demand at the lower inflation rate. This is shown in Graph C. And this is pretty much what has happened in America, Japan, and a number of other countries. Notice that during the transition period toward slower money growth, the money supply actually grows much faster than normal.
What does all this mean? Suppose you live in a world with three kinds of countries. One group has high and persistent inflation (say India, Vietnam, Argentina, Iran, etc.) Another group has normal inflation and positive interest rates. A country like Australia. And a third group is transitioning to a new steady state with lower money supply growth, lower inflation, lower NGDP growth, and near-zero interest rates. Let’s say this group includes the US, the Eurozone and Japan.
In that sort of world a graph with inflation on the horizontal axis and money growth on the vertical axis will be U-shaped. The countries with near zero interest rates will see the demand for base money soar, perhaps from 5% of GDP to 20%. During that transition the average rate of money growth will be quite rapid, despite the low inflation. The very high inflation countries will have relatively high money growth, for the normal quantity theory reasons. And the countries in the middle (such as Australia) will often have lower rates of money growth than either extreme.
So the relationship between money growth and inflation is not always monotonic, at least when you are transitioning from one money growth rate to another. This might be what confuses people. The countries that seem to have the more expansionary monetary policy (in terms of money growth) will actually include those at both extremes, those that really do have ultra-easy money, and also those with ultra-tight money.
These graphs involve some tricky interaction between changes in growth rates and changes in levels. But still, I learned this stuff in high school and I’m not that smart. Famous policymakers should be able to understand this stuff.
Even more confusing, the relationship between interest rates and monetary policy can also demonstrate a U-shaped pattern. Take a country that currently has low but positive interest rates, like Australia. You can make a good case that the RBA could increase interest rates sharply with either a much easier policy or a much tighter policy. The tighter one is what most people are familiar with—the so-called liquidity effect of less money raising short term rates. But there is also at least one monetary policy, so outrageously hyperinflationary, that it would cause lenders to immediately demand higher rates, even on fairly short term loans. So the U-shaped pattern also shows up with interest rates.
No wonder everyone’s so confused! No wonder smart people say things that, when you actually stop to think about it, are completely loony. Like complaining about an easy money policy from the most contractionary fiat money central bank in all of world history. The Zimbabwe of tight money. The very special country of Japan.
BTW, although I’ve never really been to Japan (beyond the airport), it’s one of my favorite countries. If there are any other Japanophiles out there, check out this delightful one hour podcast. Colin Marshall interviewing Pico Iyer on Japan. They had me at Colin Marshall interviews Pico Iyer.
HT: Thanks to Konstantin Mikhailov for the graphs.


