This was a light week for economic data.
The housing data – new and existing home sales – appeared a little weak in December, but the underlying details were solid. For some some commentary on the reports see: Existing Home Sales: Another Solid Report and New Home Sales and Distressing Gap. The housing recovery is ongoing.
Other positive data included a sharp drop in the 4-week average of initial weekly unemployment claims, further expansion in the Architecture Billings Index, and an increase in the ATA trucking index.
On the negative side, both the Richomd and Kansas City Fed manufacturing indexes indicated contraction in January. However, the Markit Flash PMI (for manufacturing was fairly strong).
The NMHC quarterly apartment survey indicated some loosening in the apartment market suggesting the decline in the vacancy rate might slow or even stop (just one quarter of survey results though). This will be something to watch carefully (last graph below).
Next week will be very busy!
And here is a summary of last week in graphs:
• New Home Sales at 369,000 SAAR in December
 Click on graph for larger image in graph gallery.
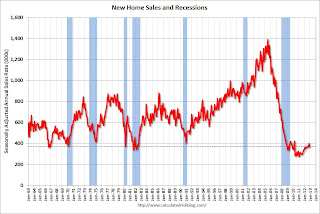
The Census Bureau reports New Home Sales in December were at a seasonally adjusted annual rate (SAAR) of 369 thousand. This was down from a revised 398 thousand SAAR in November (revised up from 377 thousand). Sales for September and October were revised up too.
The first graph shows New Home Sales vs. recessions since 1963. The dashed line is the current sales rate.
Annual 2012 sales were up almost 20% compared to 2011:
“An estimated 367,000 new homes were sold in 2012. This is 19.9 percent above the 2011 figure of 306,000.”
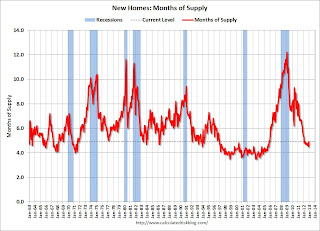 The second graph shows New Home Months of Supply.
The months of supply increased in December to 4.9 months from 4.5 months in November.
The all time record was 12.1 months of supply in January 2009.
This is now in the normal range (less than 6 months supply is normal).
“The seasonally adjusted estimate of new houses for sale at the end of December was 151,000. This represents a supply of 4.9 months at the current sales rate.”
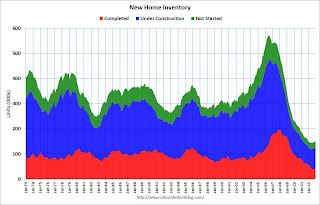 On inventory, according to the Census Bureau:
“A house is considered for sale when a permit to build has been issued in permit-issuing places or work has begun on the footings or foundation in nonpermit areas and a sales contract has not been signed nor a deposit accepted.”
Starting in 1973 the Census Bureau broke this down into three categories: Not Started, Under Construction, and Completed.
This graph shows the three categories of inventory starting in 1973.
The inventory of completed homes for sale was just above the record low in December. The combined total of completed and under construction is also just above the record low since “under construction” is starting to increase.
This was below expectations of 388,000 sales in December, but with the strong upward revision to November sales (and smaller upward revisions to September and October) this was another solid report.
New Home Sales graphs
• Existing Home Sales in December: 4.94 million SAAR, 4.4 months of supply
 Click on graph for larger image.
The NAR reports: Existing-Home Sales Slip in December, Prices Continue to Rise; 2012 Totals Up
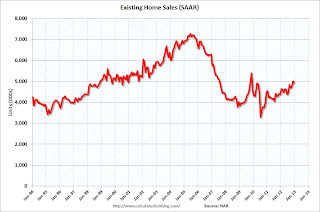
This graph shows existing home sales, on a Seasonally Adjusted Annual Rate (SAAR) basis since 1993.
Sales in December 2012 (4.94 million SAAR) were 1.0% lower than last month, and were 12.8% above the December 2011 rate.
The next graph shows nationwide inventory for existing homes.
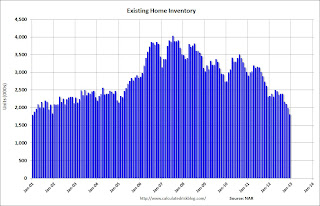 According to the NAR, inventory declined to 1.82 million in December down from 1.99 million in November. This is the lowest level of inventory since January 2001. Inventory is not seasonally adjusted, and usually inventory decreases from the seasonal high in mid-summer to the seasonal lows in December and January.
The next graph shows the year-over-year (YoY) change in reported existing home inventory and months-of-supply. Since inventory is not seasonally adjusted, it really helps to look at the YoY change. Note: Months-of-supply is based on the seasonally adjusted sales and not seasonally adjusted inventory.
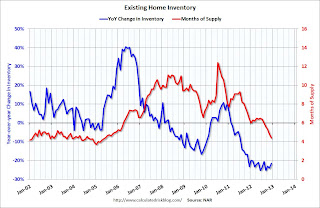 Inventory decreased 21.6% year-over-year in December from December 2011. This is the 22nd consecutive month with a YoY decrease in inventory.
Months of supply declined to 4.4 months in December, the lowest level since May 2005.
This was below expectations of sales of 5.10 million, but right at Tom Lawler’s forecast. For existing home sales, the key number is inventory – and the sharp year-over-year decline in inventory is a positive for housing.
All current Existing Home Sales graphs
• AIA: “Fifth Consecutive Month of Gains in Architecture Billings Index”
 Note: This index is a leading indicator primarily for new Commercial Real Estate (CRE) investment.
From AIA: Fifth Consecutive Month of Gains in Architecture Billings Index
This graph shows the Architecture Billings Index since 1996. The index was at 52.0 in December, down from 53.2 in November. Anything above 50 indicates expansion in demand for architects’ services.
According to the AIA, there is an “approximate nine to twelve month lag time between architecture billings and construction spending” on non-residential construction. This suggests some increase in CRE investment in 2013.
• Weekly Initial Unemployment Claims decline to 330,000
 The DOL reports:
In the week ending January 19, the advance figure for seasonally adjusted initial claims was 330,000, a decrease of 5,000 from the previous week’s unrevised figure of 335,000. The 4-week moving average was 351,750, a decrease of 8,250 from the previous week’s revised average of 360,000.
The dashed line on the graph is the current 4-week average. The four-week average of weekly unemployment claims decreased to 351,750.
This is the lowest level for the 4-week average since early 2008. Note: Data for January has large seasonal adjustments – and can be very volatile, but this is still good news.
Weekly claims were below the 360,000 consensus forecast.
• NMHC Apartment Survey: Market Conditions Loosen Slightly
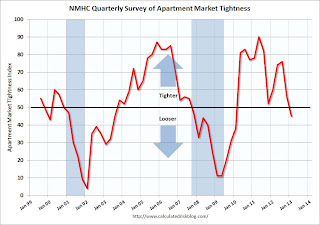
From the National Multi Housing Council (NMHC): Expansion Moderates for Apartment Markets in January
This graph shows the quarterly Apartment Tightness Index. Any reading above 50 indicates tightening from the previous quarter. This quarterly decline followed eleven consecutive quarters with tighter market conditions.
The recent Reis data showed apartment vacancy rates fell in Q4 2012 to 4.5%, down from 4.7% in Q3 2012. As Obrinsky noted, markets are still tight, but this might suggest the vacancy rate will stop declining (caveat: this is just one quarter of survey data and the index might bounce back).
On supply: Even though multifamily starts have been increasing, completions lag starts by about a year – so the builders are still trying to catch up. There will be many more completions in 2013 than in 2012, increasing the supply.
As I’ve mentioned before, this index helped me call the bottom for effective rents (and the top for the vacancy rate) early in 2010. This survey now suggests vacancy rates might stop falling – a possible significant market change – although apartment markets are still tight, so rents will probably continue to increase.