Has gold already bottomed? Did we miss a great buying opportunity or will there be a better one ahead? Here is a look at three indicators (along with charts) that help narrow down the next best entry point.
Following gold’s record setting decline, gold prices have rallied 10% and the (gold) dust is starting to settle. Does that mean the bottom is in for gold?
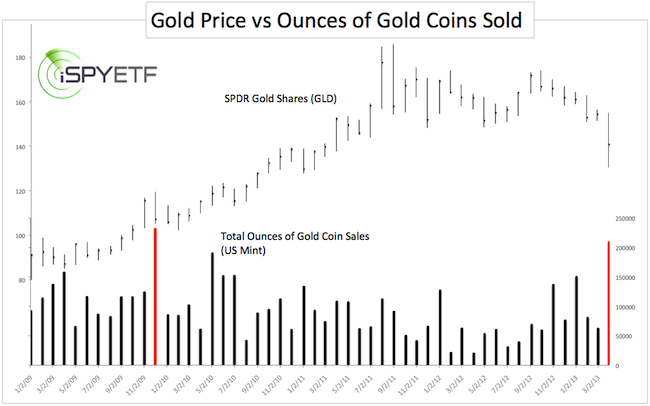
Demand For Gold Coins at Record High
The drop in gold prices was viewed as a buying opportunity by gold coin investors. The United States Mint sold a record 208,500 ounces of gold coins in April 2013 (data as of April 29). The only month investors bought more gold coins was in December 2009.
Gold prices and the SPDR Gold Shares (GLD) dipped a bit lower in January and February and soared thereafter (see chart).
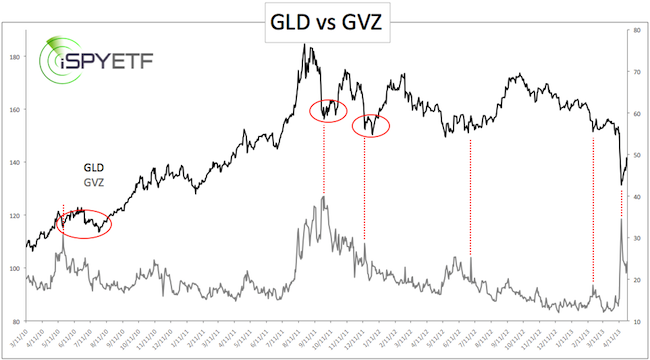
GLD Option Volatility Soared at Recent Low
A few years back the CBOE launched the CBOE Gold ETF Volatility Index (GVZ). GVZ measures the market’s expectation of 30-day volatility of gold prices by applying the VIX methodology to options on SPDR Gold Shares (GLD). GVZ works like a VIX for GLD.
When the VIX soars, stocks usually find a bottom. When GVZ soars, the Gold ETF usually finds a bottom. In mid-April GVZ spiked to the highest level since gold’s 2011 meltdown.
This kind of volatility event tends to shake out a ton of ‘weak hands,’ but doesn’t always punctuate the final low. The red circles in the chart below illustrate that lasting lows frequently take the shape of a double bottom.
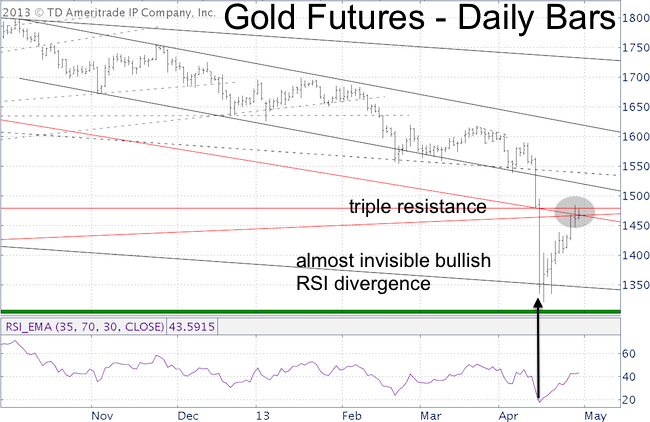
Up Against Resistance With Only a Minor Bullish RSI Divergence
Lasting price lows usually coincide with waning selling pressure. This creates a bullish RSI divergence (price makes a new low, RSI doesn’t). Ideally there should be a few days in between the RSI and the actual price low.
At the April 16 low for gold, there was a small RSI divergence (one day difference between price and RSI low). Such small divergences can lead to larger scale lows (one example is the March low in 30-year Treasuries), but the absence of a clearly visible RSI divergence generally results in a price relapse and double bottom.
The bar chart below shows gold prices in relation to RSI and various support/resistance levels monitored by the Profit Radar Report. Gold prices are currently pressing against triple resistance.
Sustained trade above resistance would suggest that gold is ready to rally further. Another dip to or towards new lows, however, would provide a much more attractive buying opportunity.