The Volatility Index (VIX) has not lived up to its contrarian indicator reputation, but there is another CBOE options index that’s provided some noteworthy signals. Say hello to the options indicator of the future – the SKEW.
A pilot literally monitors dozens of controls to navigate the aircraft safely through the air.
Like a pilot, the Profit Radar Report constantly monitors dozens of different stock market gauges.
Once a month, the Profit Radar Report publishes the Sentiment Picture. Radar like, the Sentiment Picture searches for sentiment extremes.
Shown below is the May 2013 Sentiment Picture (published on May 19), which plots the S&P 500 against five different sentiment gauges:
1) CBOE VIX
2) CBOE SKEW
3) CBOE Equity Put/Call Ratio
4) Percentage of bullish advisors polled by Investors Intelligence (II)
5) Percentage of bullish investors polled by the American Association for Individual Investors (AAII)
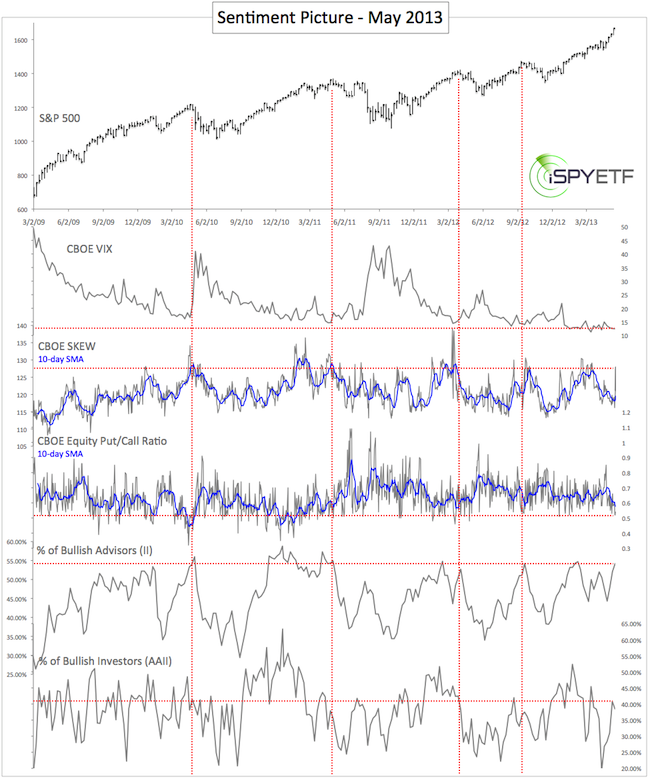
After many months of average readings, the May Sentiment Picture finally showed some extremes. Most notable were the up tick in the SKEW and the drop in the equity put/call ratio.
Unlike polls, the equity put/call ratio is an actual money flow indicator. It showed that investors are putting their money where their mouth is and indicated that risk for bulls was rising.
The actual sell signal was triggered based on technical analysis on May 28 with a target of 1,594 – 1,598 for the S&P 500.
The sell signal proved correct, but it was in contradiction to a bearish SKEW extreme, which is generally bullish for stocks.
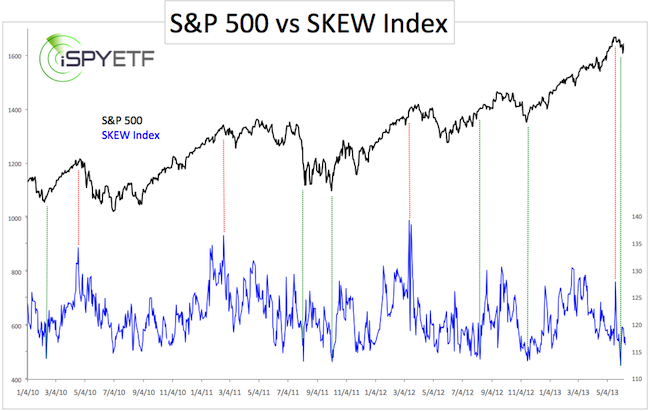
On May 28, the SKEW was about the only indicator that suggested higher stock prices. Although the SKEW is quite accurate (see green and red lines on the second chart) its message was simply overruled by the majority of bearish indicators (but its message was only tucked away, not forgotten).
The SKEW – an options-based index like the VIX – in essence estimates the probability of a large decline. A reading of 135+ suggests a 12% chance of a large decline (two standard deviations). A reading of 115 or less suggests a 6% chance of a large decline. In short, the higher the SKEW, the greater the risk for stocks.
The second chart plots the S&P 500 against the SKEW only.
A week later the lonely SKEW signal received backup by extremely bad breadth. Breadth was so bad, it’s actually good.
The June 6 article iSPYETF article noted a NYSE Advance/Decline Ratio that’s usually seen at market bottoms. Now there were two – the NYSE A/D ratio and the SKEW.
Both gauges have a good track record and on June 6 stocks staged a bullish intraday reversal after nearly touching the 1,598 down side target. It seems like options traders were the first to ‘know’ that a bounce was forthcoming.
A pilot is taught to always trust his instruments, not his instincts or emotions. Investment gauges aren’t as reliable as aircraft instruments, but investors should trust them much more than their own emotions. Does the bounce have legs?
The ‘instruments’ are telling me right now that stocks need to move above resistance (the lower lows, lower highs sequence has yet to be broken) or below support to trigger the next move. This may sound vague, but sometimes the market lacks clarity and when that happens it’s smart to stay on the sidelines.
It’s better to miss a trade than to lose money on a trade. The job of the Profit Radar Report is to spot and profit from high probability trades.